Lab 11 - IAC & NETWORK INSIGHTS API#
1. Create VPCs, Transit GW, Spoke GW and Attachment through Terraform#
All the elements you have created through the UI, can also be created through the API or the official Aviatrix Terraform provider.
You can find more information on these here: https://registry.terraform.io/providers/AviatrixSystems/aviatrix/latest/docs
2. Validate#
We have prepared some Terraform code for you, which you will explore and deploy.
Go to your personal POD Portal, identify the Lab11 section and click on the Open Workstation button.
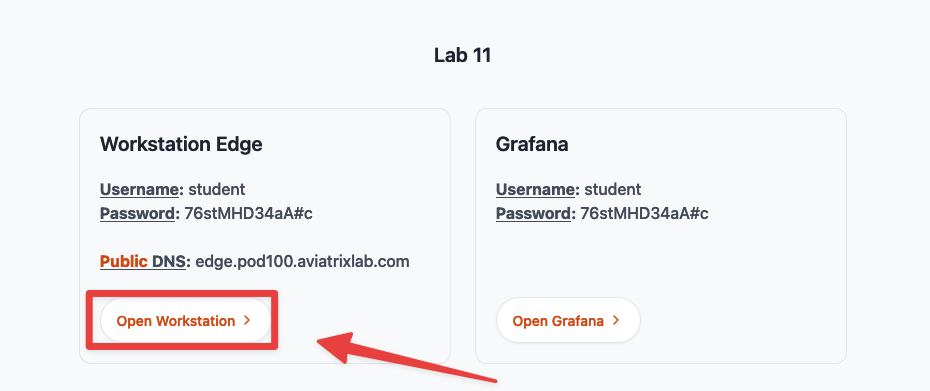
Fig. 438 Lab 11 section on the POD Portal#
Insert the corresponding credentials, available on the POD Portal, to log in to the remote “edge” Workstation.
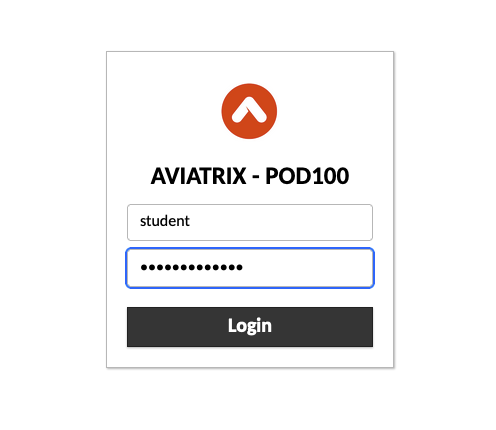
Fig. 439 Edge Workstation credentials#
Open the Visual Studio Code located on the Desktop
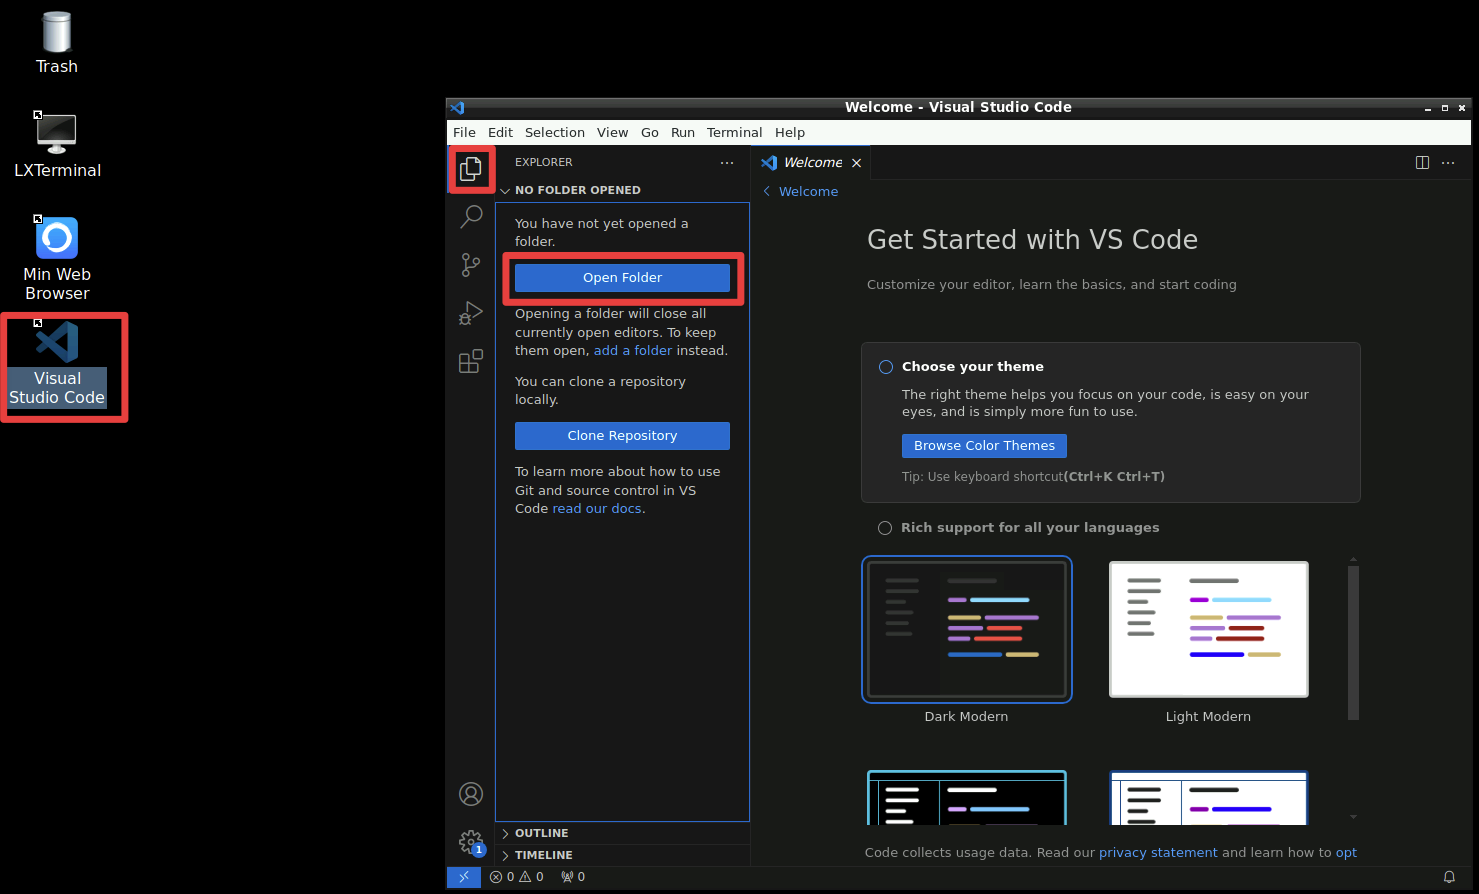
Fig. 440 VS Studio#
Click on the Home icon and then select the folder
terraform-laband click OpenWhen prompted to trust the authors of the files in this folder, select Yes
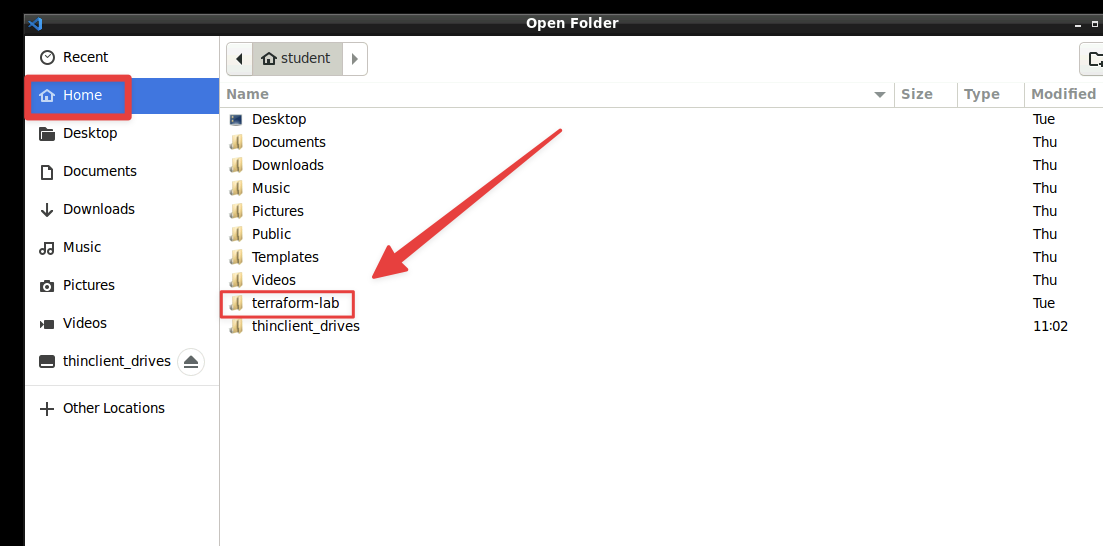
Fig. 441 terraform-lab folder#
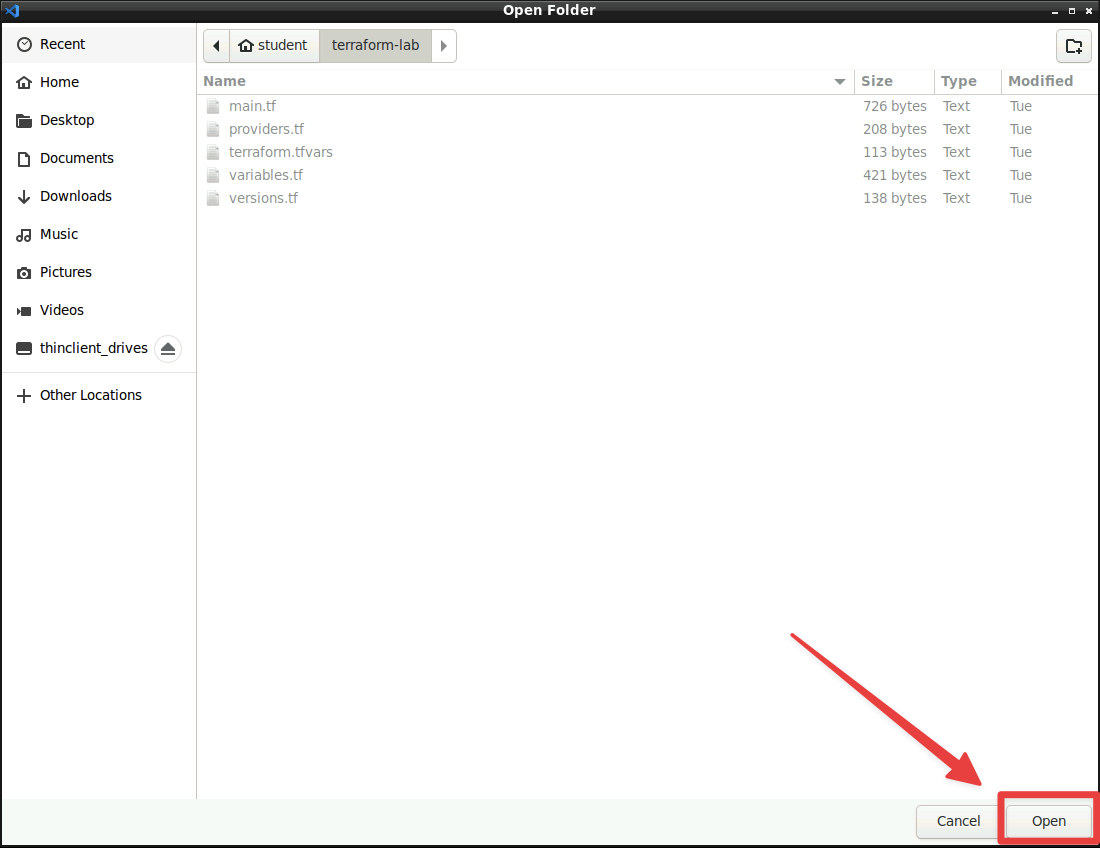
Fig. 442 Click “Open”#
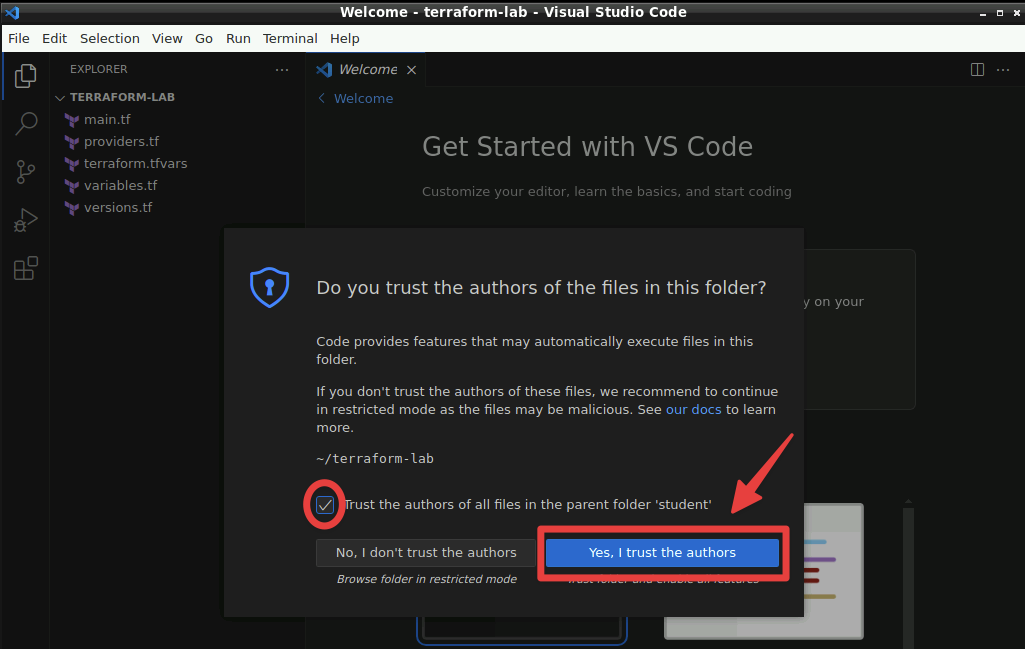
Fig. 443 Yes, I trust the authors#
Let’s explore the Terraform files in this directory:
Explore the file contents of main.tf, variables.tf, providers.tf and terraform.tfvars
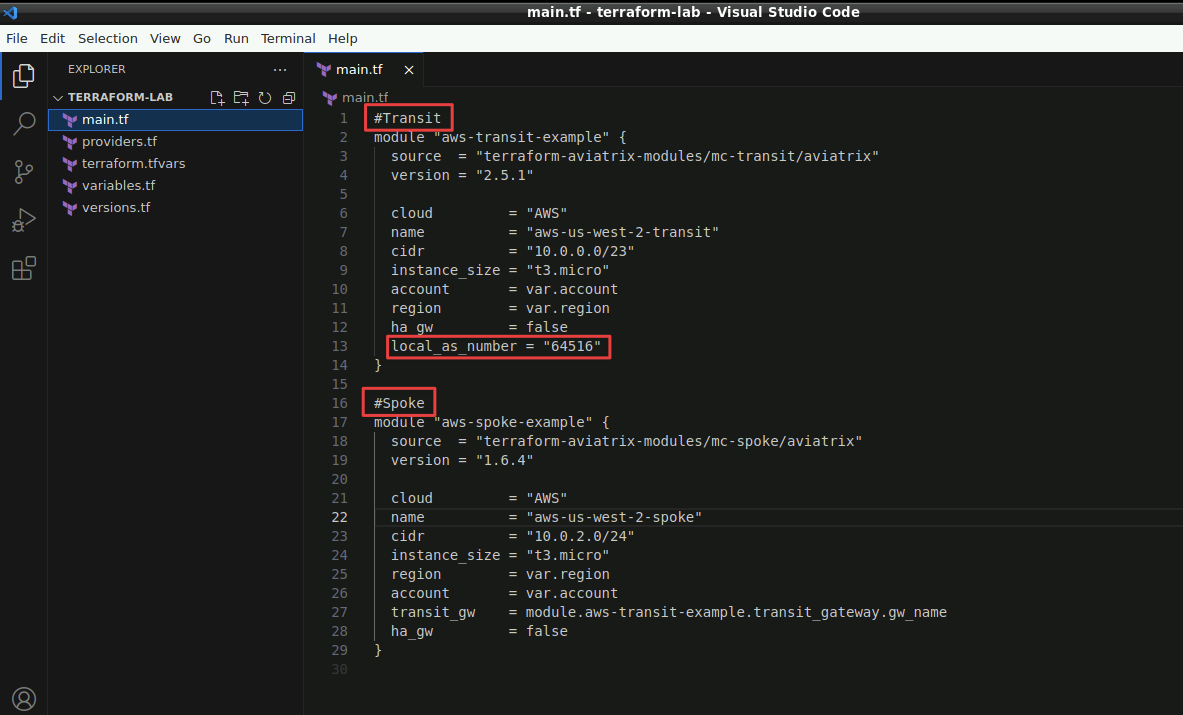
Fig. 444 Manifest#
What do you expect will be created when we run this Terraform code?
In this lab, we are using Terraform modules, provided by Aviatrix. These allow you to quickly build out your environment, based on larger building blocks, rather than individual resources. You can find more available modules here:
https://registry.terraform.io/namespaces/terraform-aviatrix-modules
Let’s run this code.
Open the LXTerminal App on the Desktop
Move over to the directory where the Terraform files are located:
cd terraform-lab
First thing we need to do is to initialize Terraform. This allows for the required providers and modules to be downloaded.
terraform init
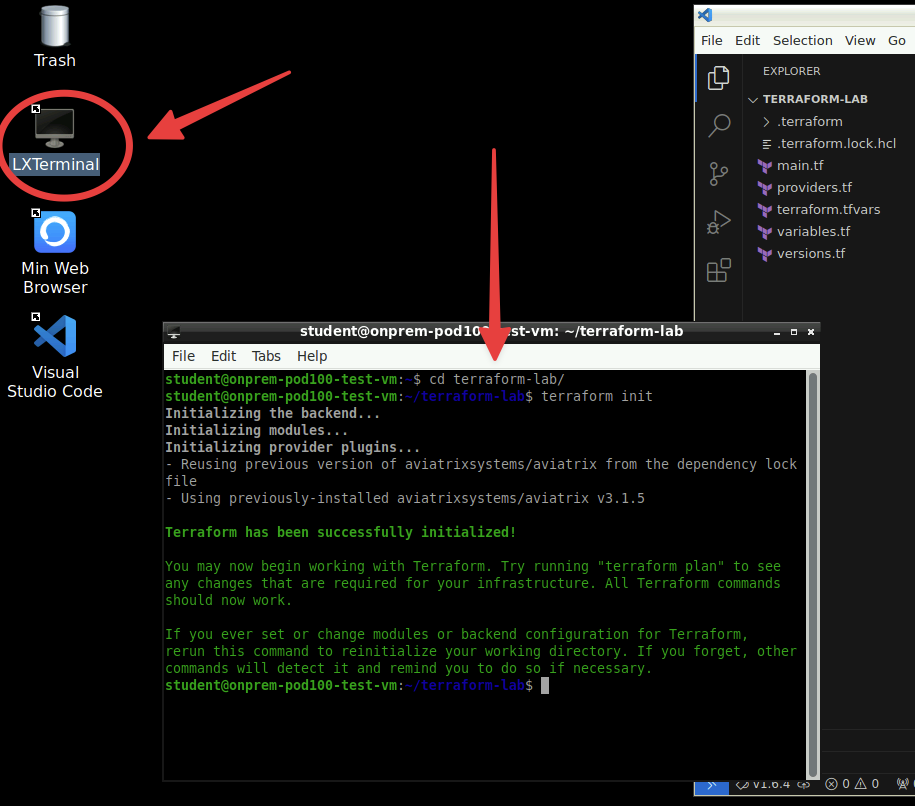
Fig. 445 Visual Studio Code#
Next we will execute a “plan”. This means that Terraform will compare the live environment with the desired state we declared in our Terraform files.
terraform plan
Investigate the proposed changes by Terraform. Now we will apply them to the live environment:
terraform apply --auto-approve
Once Terraform is finished, have a look at the newly created terraform.tfstate file. This contains information of all infrastructure created through Terraform. This is referred to as “the state”. Losing it can cause a lot of trouble, but that is for another (Terraform) lesson.
Expected Results#
By running the above commands, you should see how simple it can be to automate your infrastructure deployments using Terraform. With a few lines of code and after about 6 minutes, you should see the new transit and spoke in CoPilot Topology.
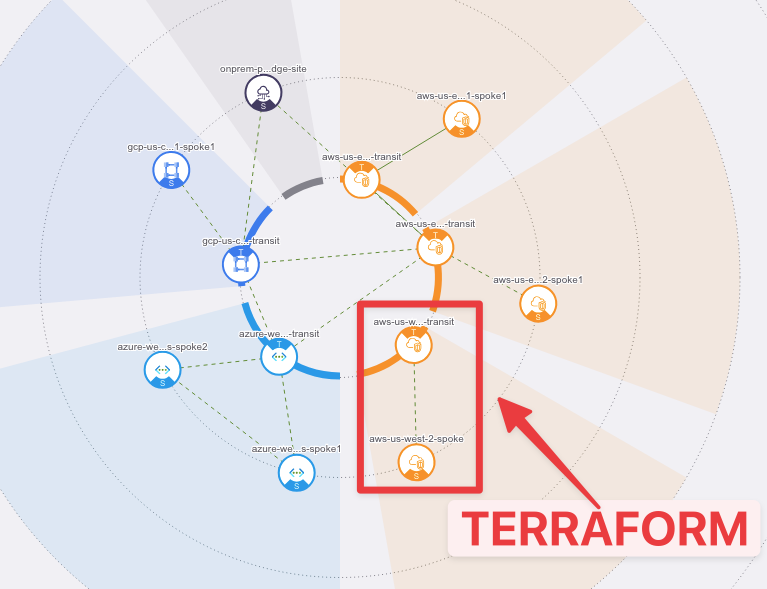
Fig. 446 Topology#
3. Create Transit Peering#
Description#
In the previous exercise, we deployed a new Transit VPC, Aviatrix Transit Gateway, a Spoke VPC, and an Aviatrix Spoke Gateway. This new deployment is more or less an island, but let’s see how we can use Infrastructure as Code to build a full mesh of the Transits.
Validate#
Using the same Visual Studio Code session, let’s create the
peering.tffile.We will be using the following module:
https://registry.terraform.io/modules/terraform-aviatrix-modules/mc-transit-peering/aviatrix/latestGo back to the Visual Studio Code session and create a new file. Name it
peering.tf.
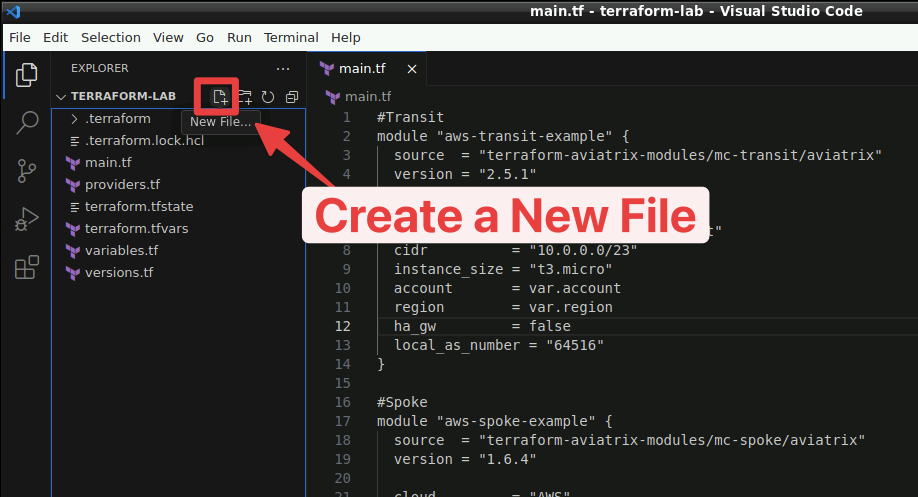
Fig. 447 New File#
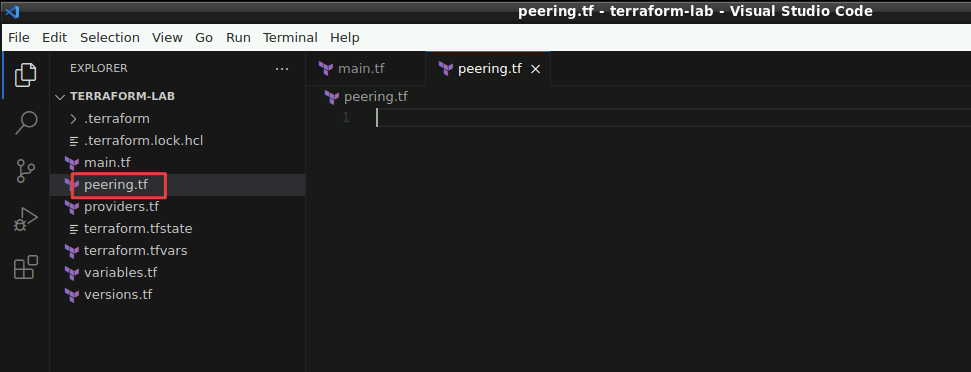
Fig. 448 peering.tf#
Now copy the following statements and paste them inside the file previously created:
module "transit-peering" {
  source  = "terraform-aviatrix-modules/mc-transit-peering/aviatrix"
  version = "1.0.9"

  transit_gateways = [
    "aws-us-west-2-transit",
    "aws-us-east-2-transit"
  ]
}
Note
Copy and Paste does not work directly from the host machine towards the Workstation “Edge”, therefore activate the Hidden Menu, that is a sidebar that is maintained hidden until explicitly enabled. On a desktop or other device which has a hardware keyboard, you can show this menu by pressing Ctrl+Alt+Shift on Windows machine (Control+Shift+Command on Mac).
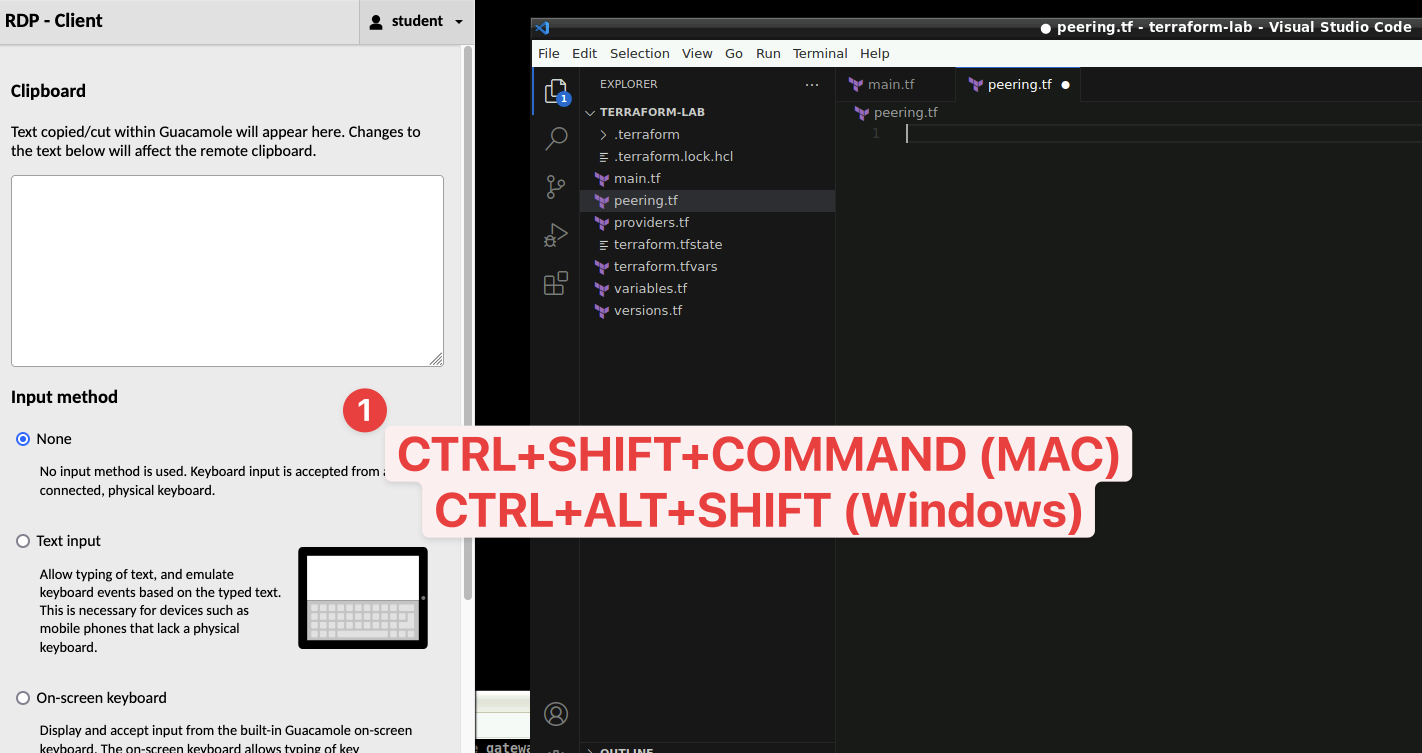
Fig. 449 Hidden Clipboard#

Fig. 450 Copy the statemets from the Lab Guides and paste them#
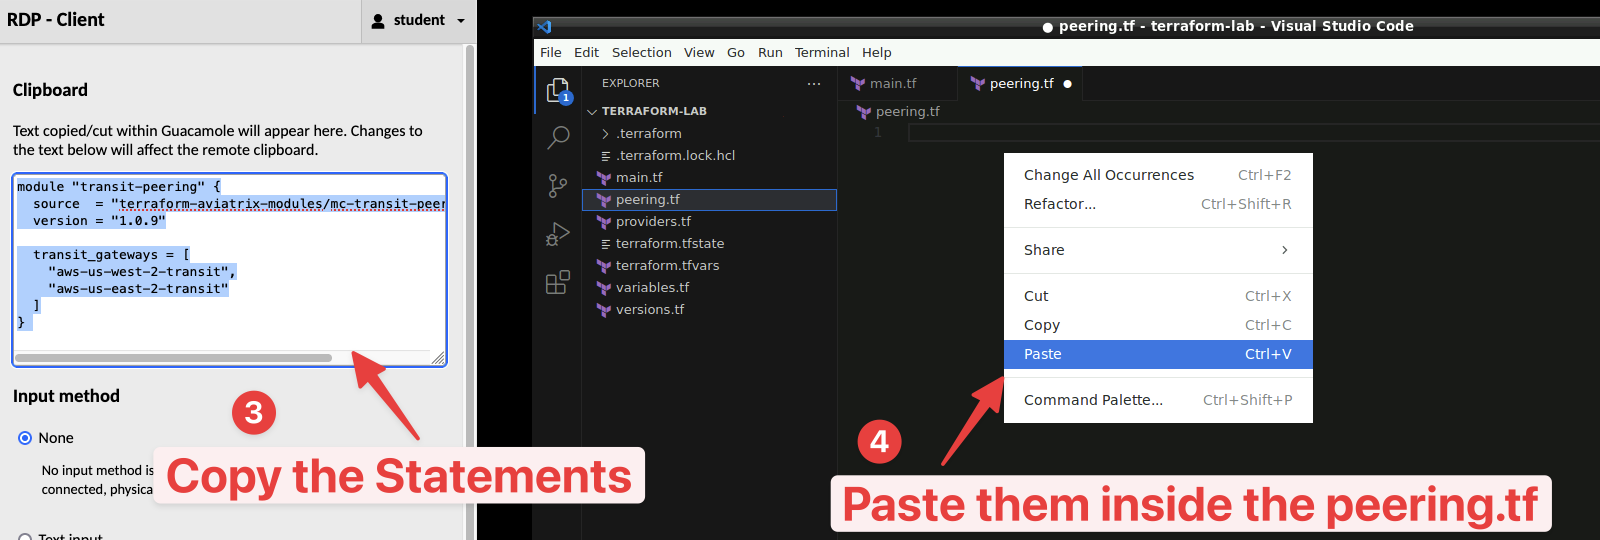
Fig. 451 Copy from the hidden clipboard and paste them inside the peering.tf#
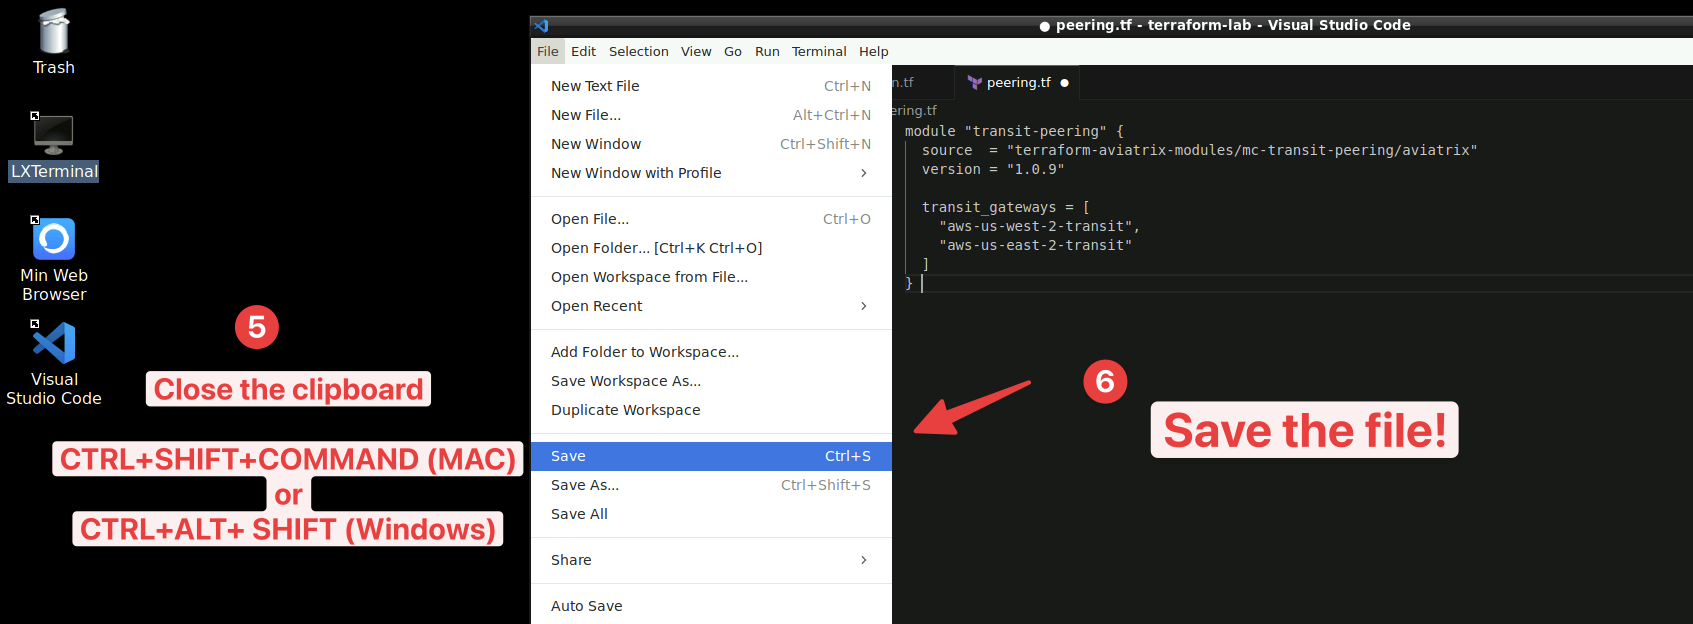
Fig. 452 Close the Clipboard and save!#
SAVE the file in Visual Studio Code.
Go back to the LXTerminal and run
terraform initagain to download themc-transit-peeringmodule
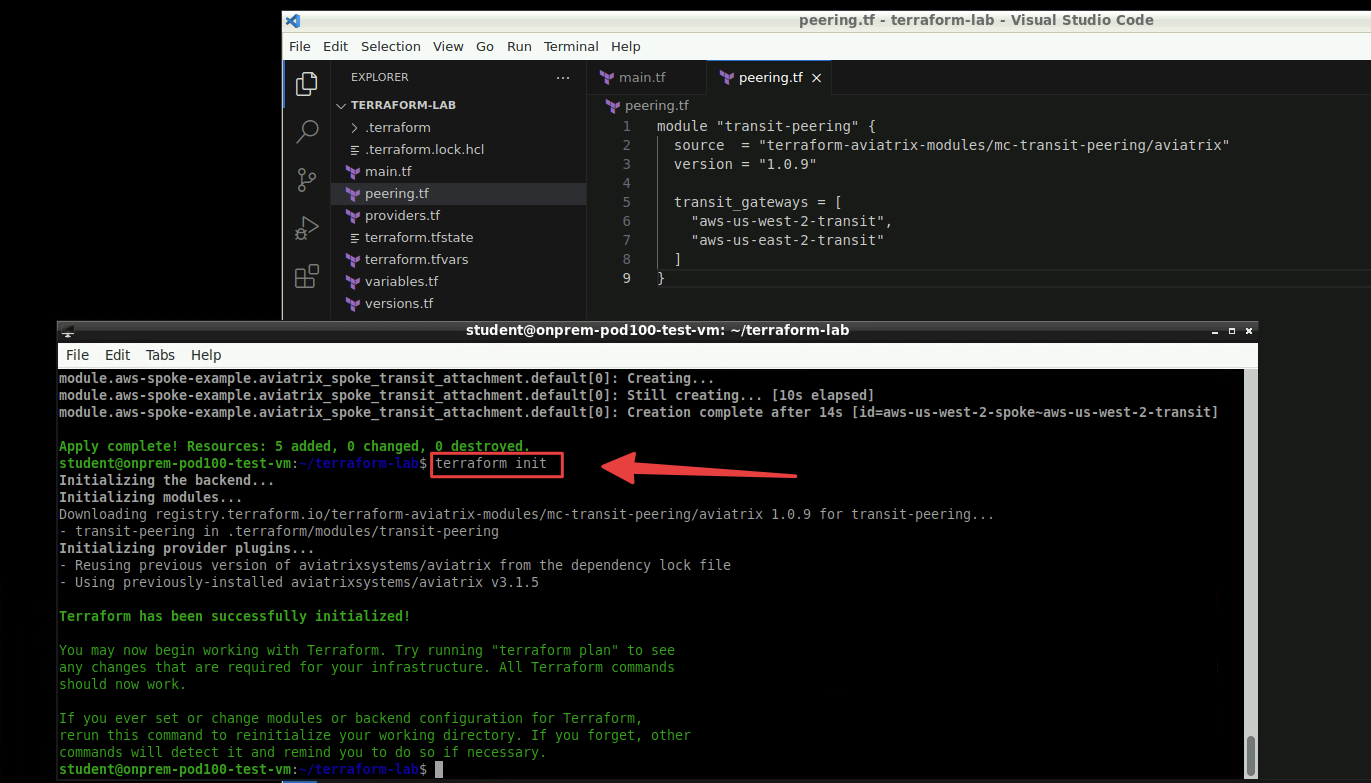
Fig. 453 Once again “terraform init”#
Run the command
terraform planto assess the changes
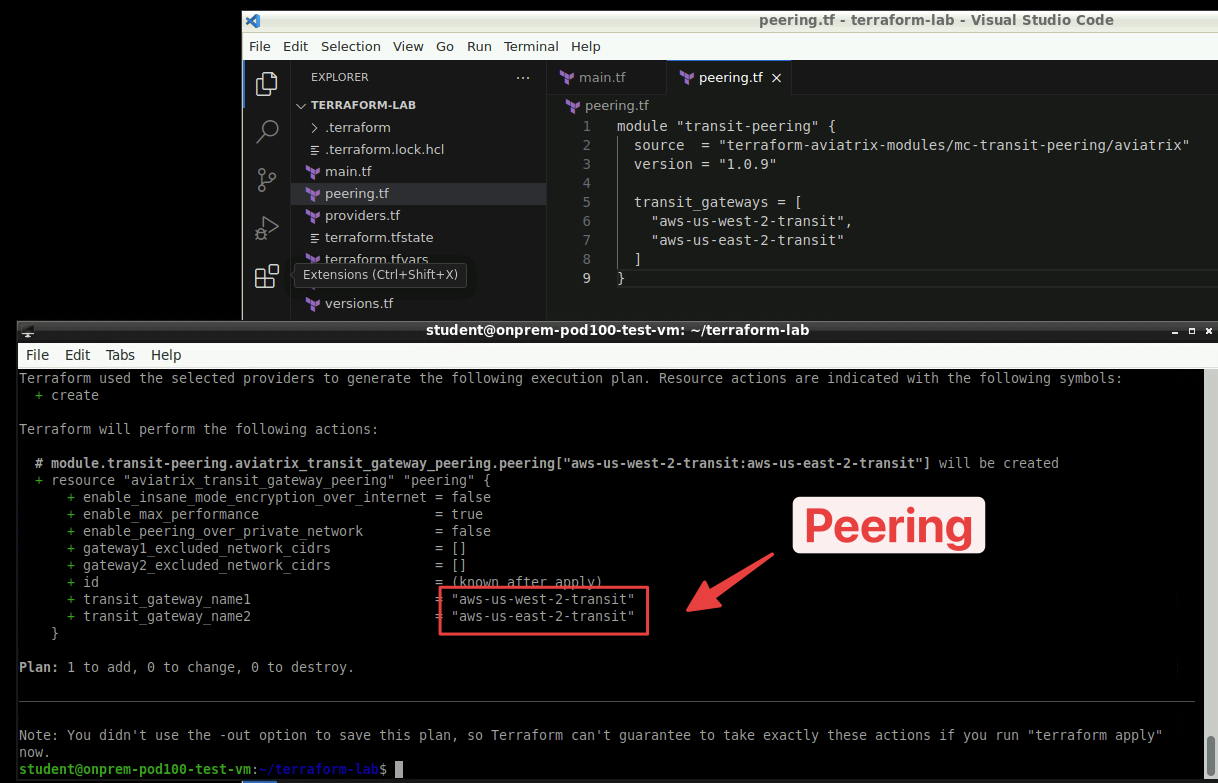
Fig. 454 Once again “terraform plan”#
Run the command
terraform apply --auto-approve
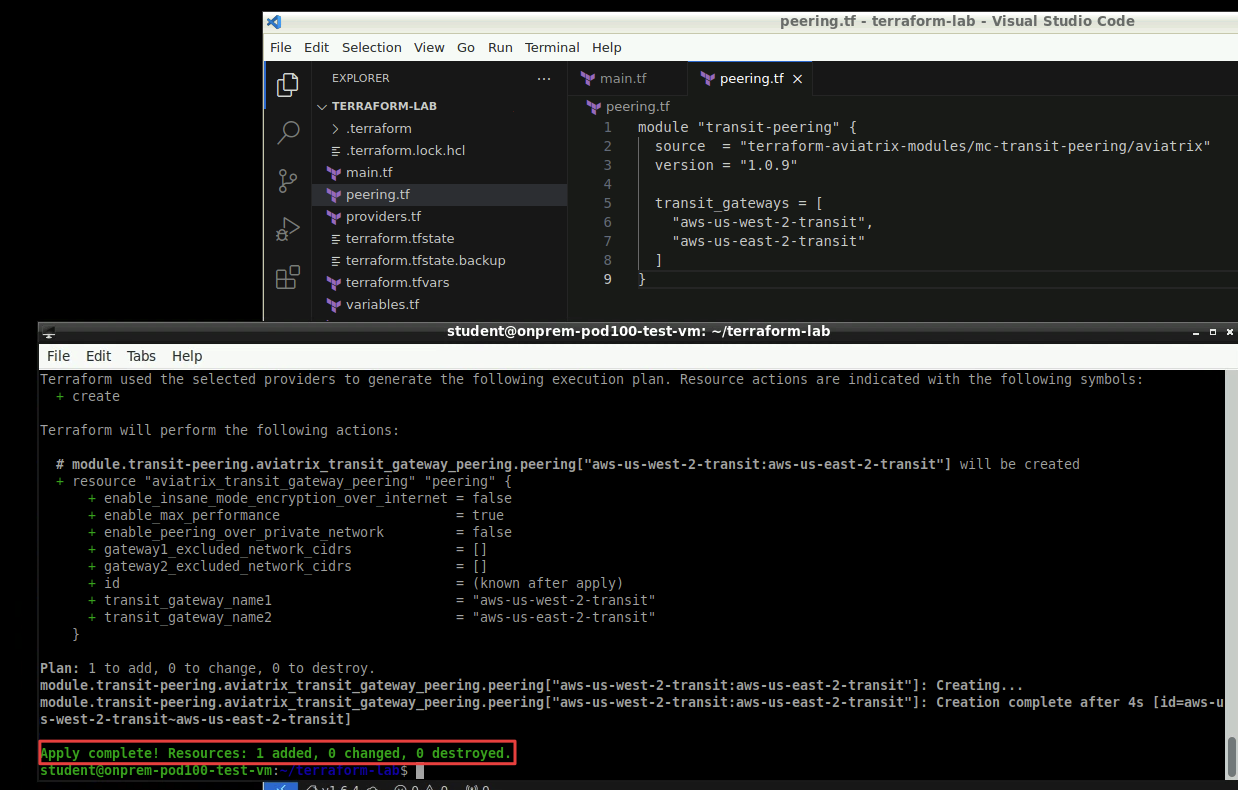
Fig. 455 Once again “terraform apply”#
Expected Results#
After a few minutes, a new peering will be established between the aws-us-east-2-transit GW and the aws-us-west-2-transit GW. You can go to CoPilot and have a look at the new topology.
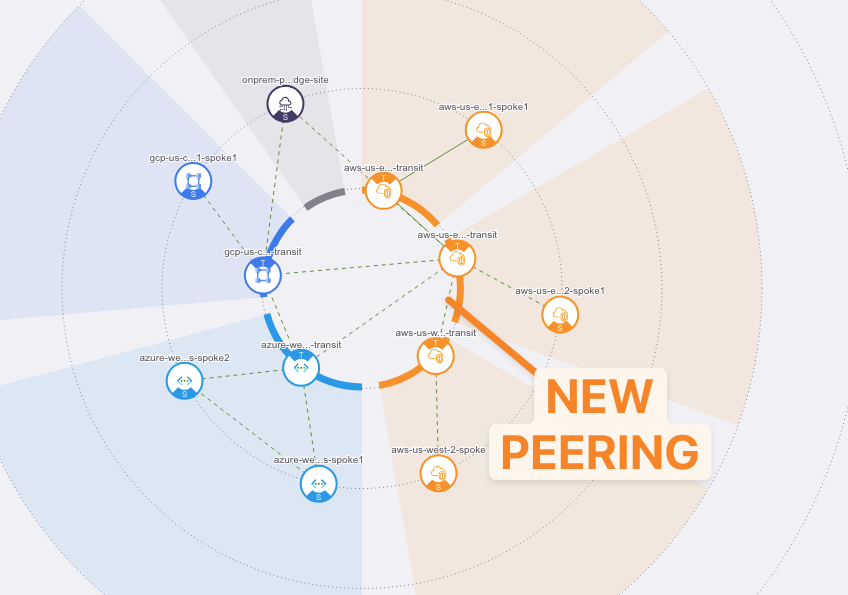
Fig. 456 New Peering#
Congratulations, you have deployed the full-blown Aviatrix solution!
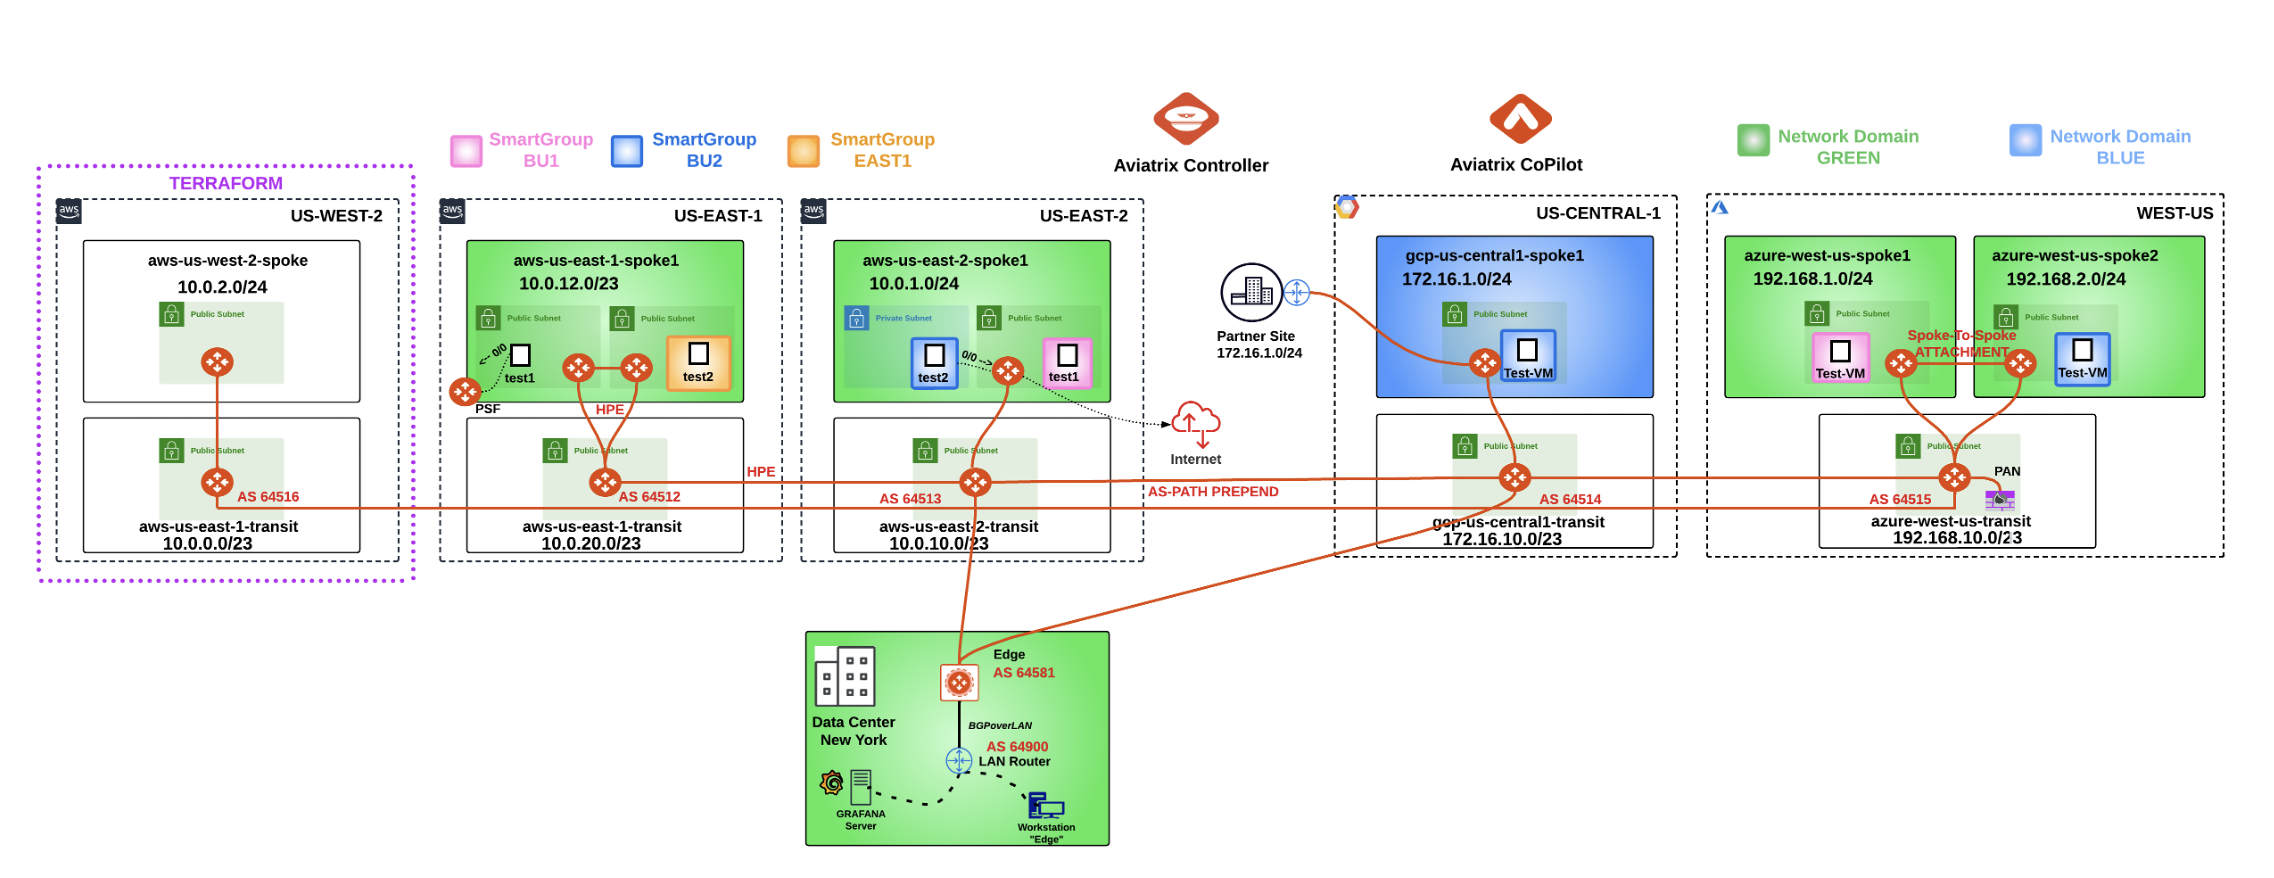
Fig. 457 Full-Blown Aviatrix Solution#
4. IAC Summary#
You deployed an Aviatrix Transit and Spoke using Terraform
You added the new Transit to the Global Multicloud Transit Network with a few lines of code
Infrastructure as Code and Terraform are a perfect complement to the Aviatrix solution
In minutes, you can create the network, security and connectivity needed
5. - Network Insights API#
Description#
The Aviatrix Network Insights API simplifies the process of navigating network interface statistics and micro-gateway status data. By integrating this API with your visualization platforms (with vendors you already know and love!), you can easily make data-driven decisions.
Validate#
Go to your personal POD Portal, identify the Lab11 section and click on the
Open Grafanabutton.
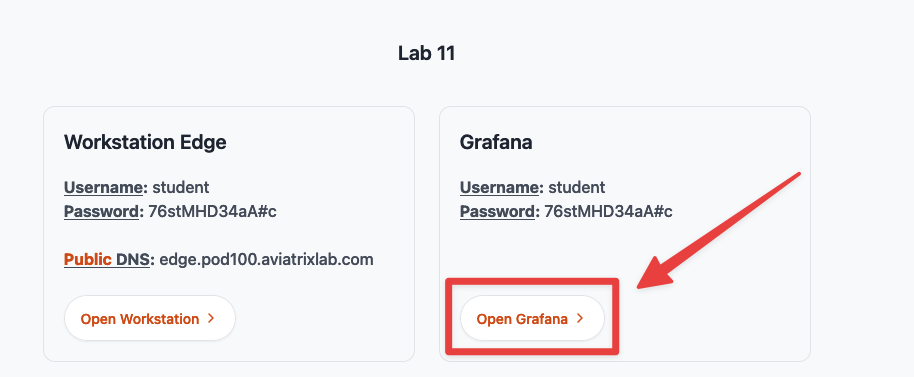
Fig. 458 Lab 11 section on the POD Portal#
Important
The API Key was generated at the lunch of all PODs and was applied on the Prometheus/Grafana server!
Enter the required credentials that are available on the POD Portal and then click on Log in.
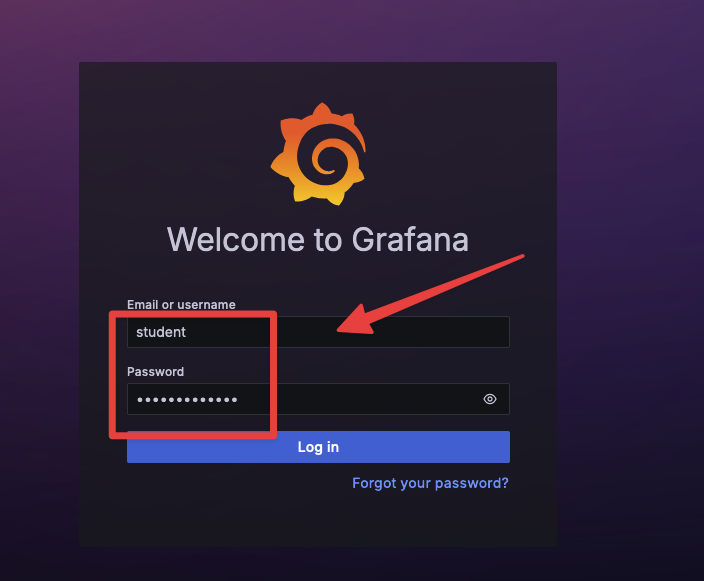
Fig. 459 Grafana Login Page#
You will immediately notice the Receive Rate and Transmit Rate stats!
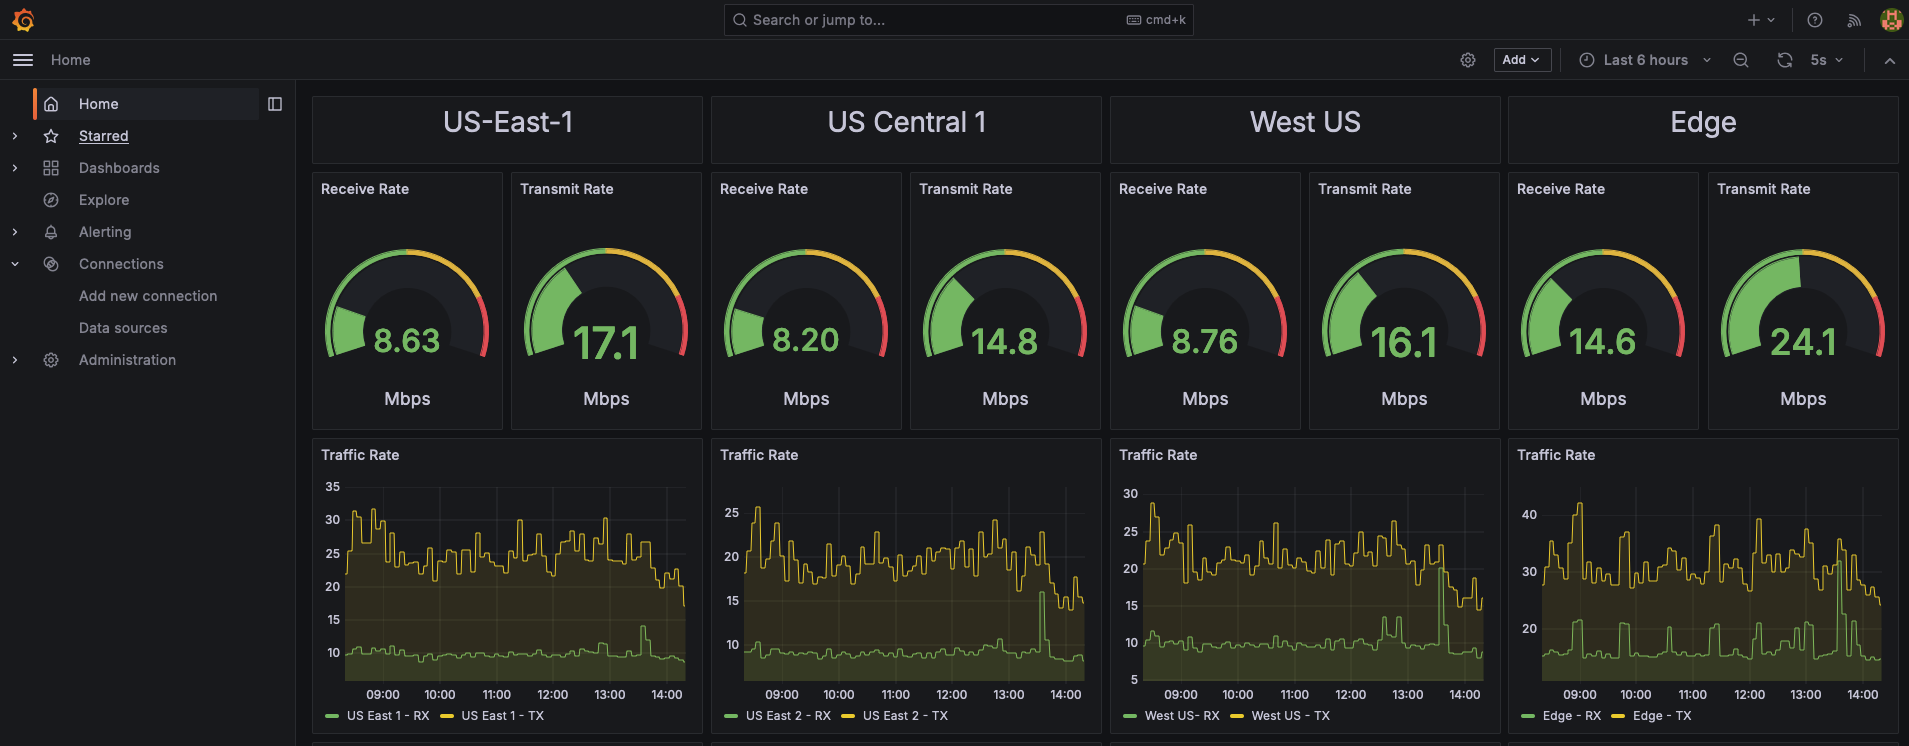
Fig. 460 Receive Rate and Transmit Rate#
Caution
Go to CoPilot > Settings > Configuration and then identify the "Network Insights API" widget.
You will find the API Key generated on the CoPilot and then used on Prometheus/Grafana!

Fig. 461 Network Insight API section#
Tip
Download the API Key and explore the content of the file!
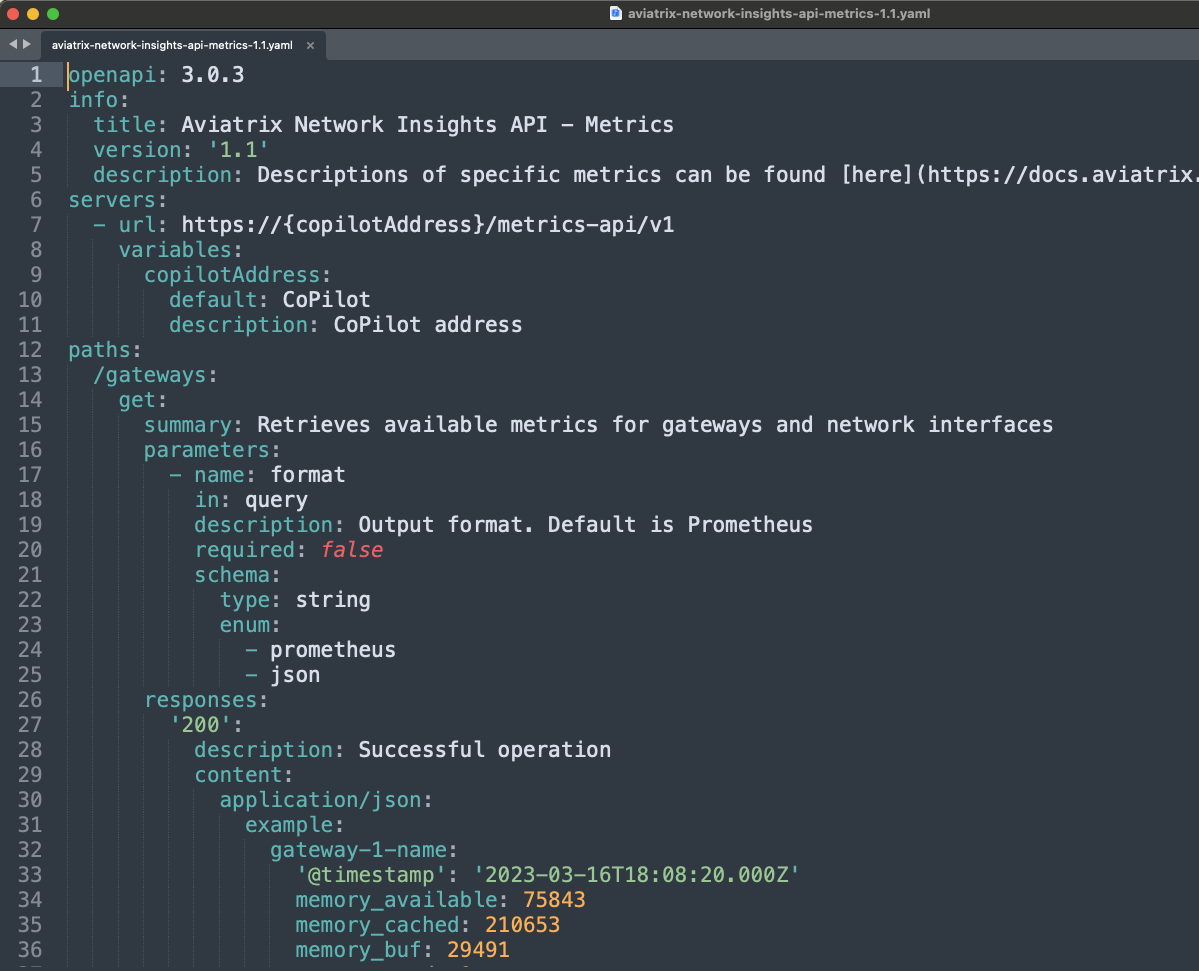
Fig. 462 API key#
