Lab 1 - Network Domains#
1. SCENARIO#
Infrastructure was segmented recently into 2 network domains: BU1 & BU2.
You are requested to ascertain the segregation between the two network domains.
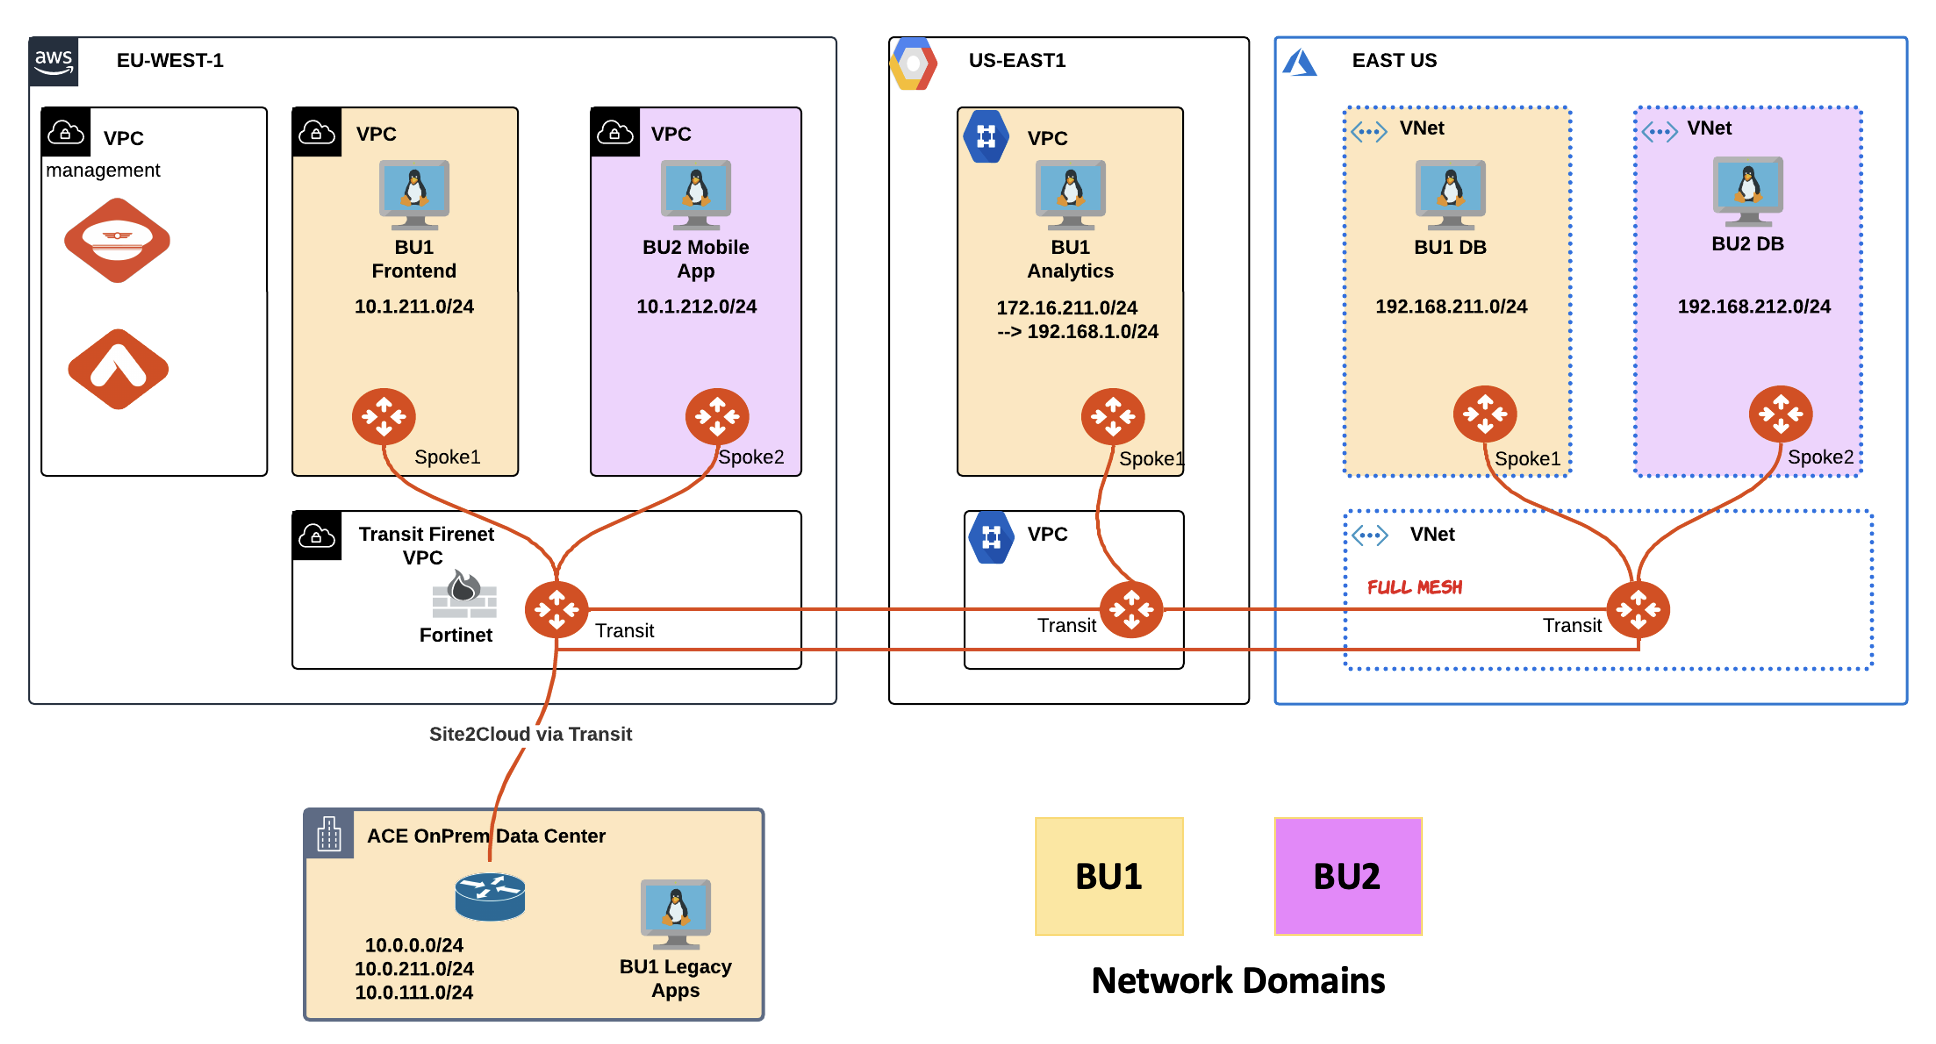
Fig. 2 Initial Topology#
2. VALIDATION REQUEST#
Go to CoPilot > Settings > Resources > Task Server
Ensure that both Fetch GW Routes and Fetch VPC Routes intervals are set to “1 second” each and then click on SAVE.
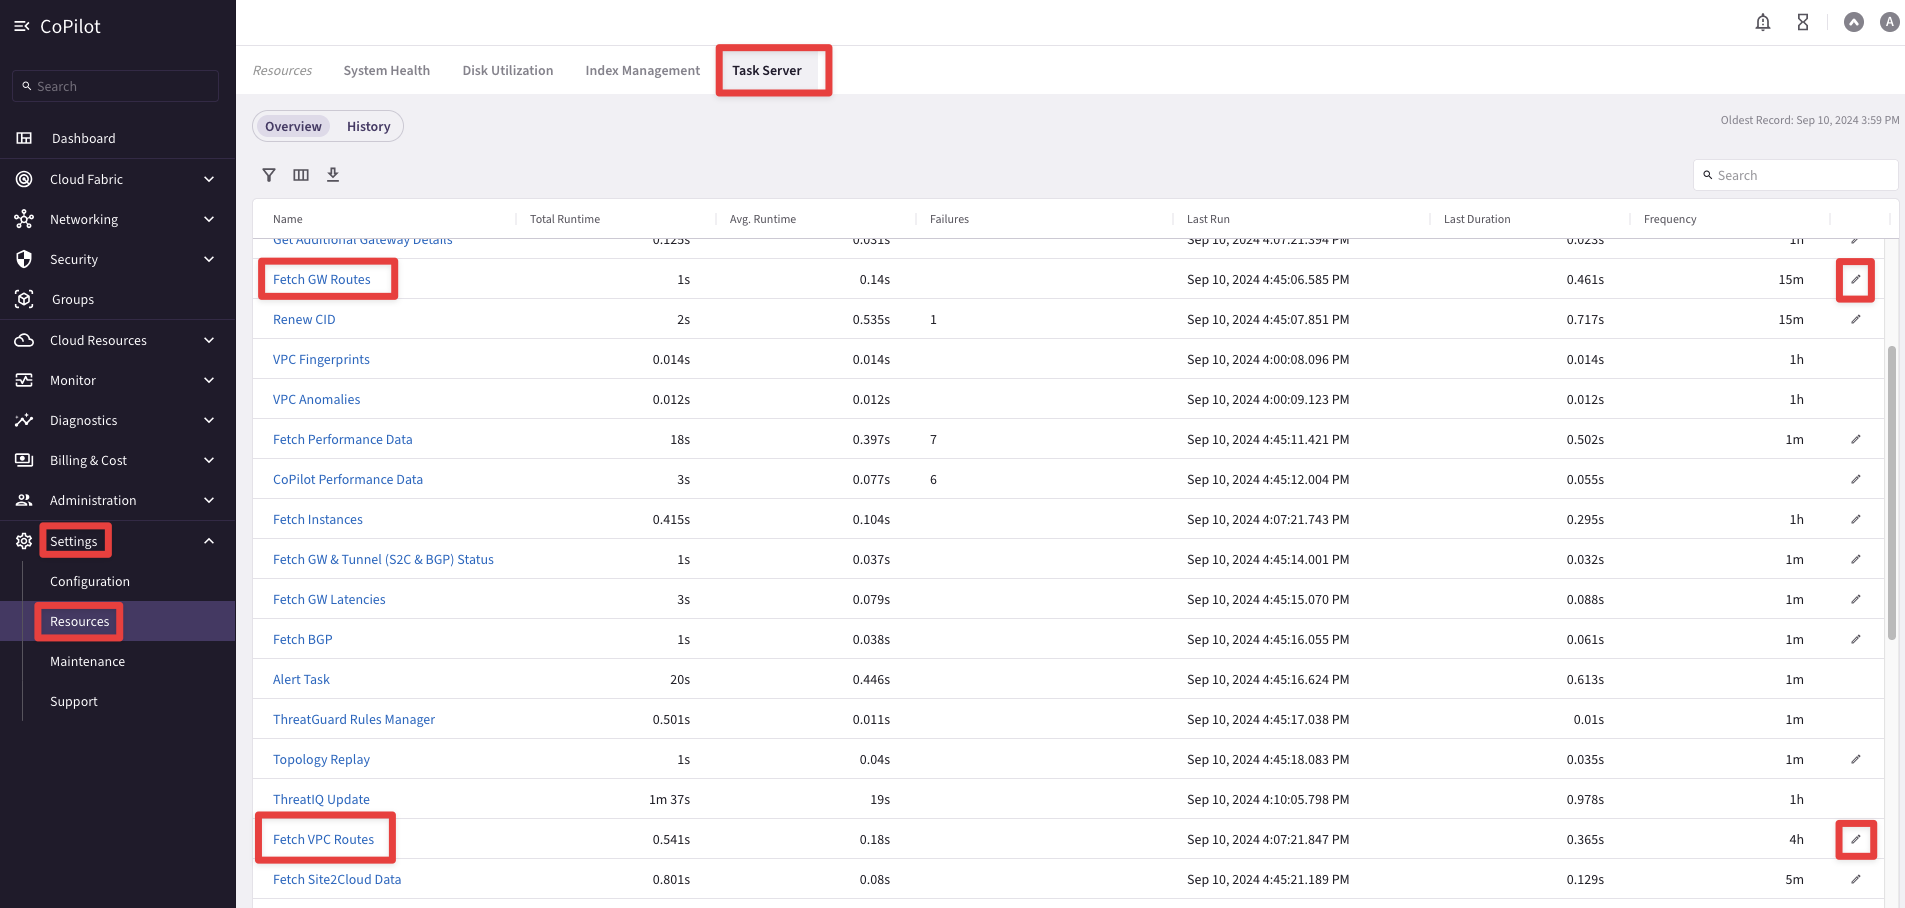
Fig. 3 Task Server#
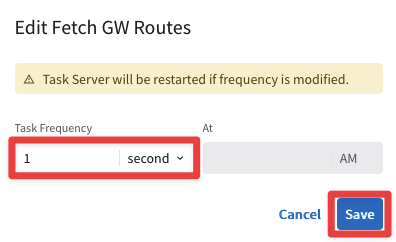
Fig. 4 Fetch GW Routes#
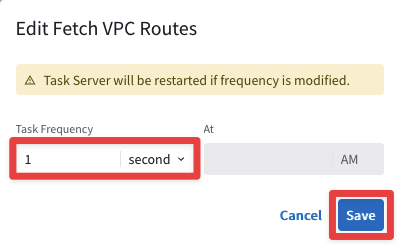
Fig. 5 Fetch VPC Routes#
Afterwards, click on Commit.
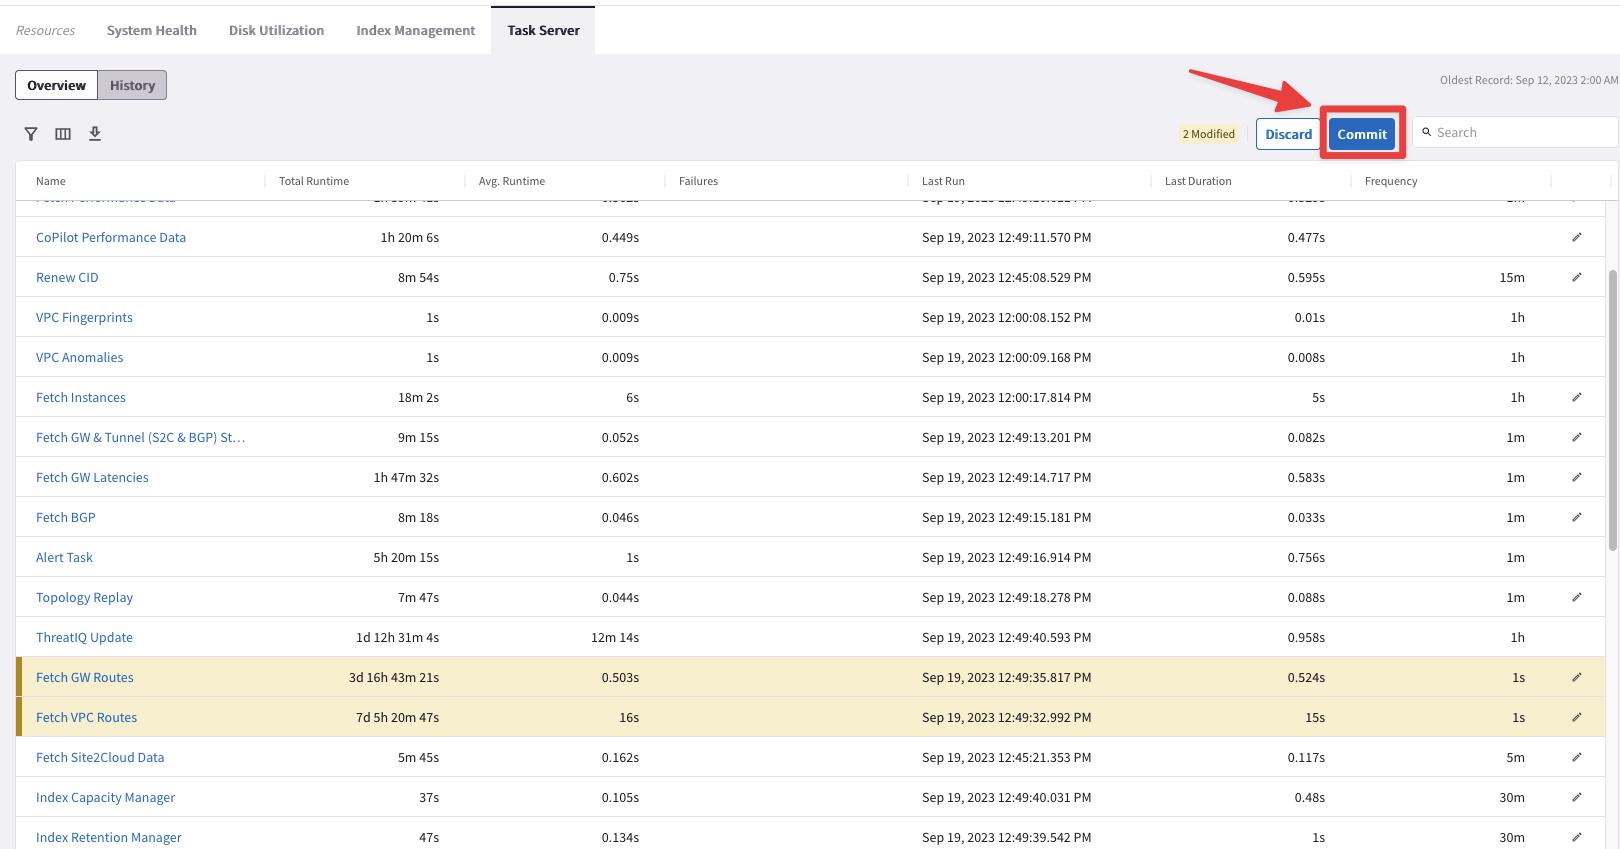
Fig. 6 Commit#
Warning
These are very aggressive settings. In a Production environment, you should NOT set these intervals that frequently!
Go to CoPilot > Cloud Fabric > Topology to explore your POD topology.
You will notice that the CoPilot is showing both the Managed VPCs and the Unmanaged VPCs.
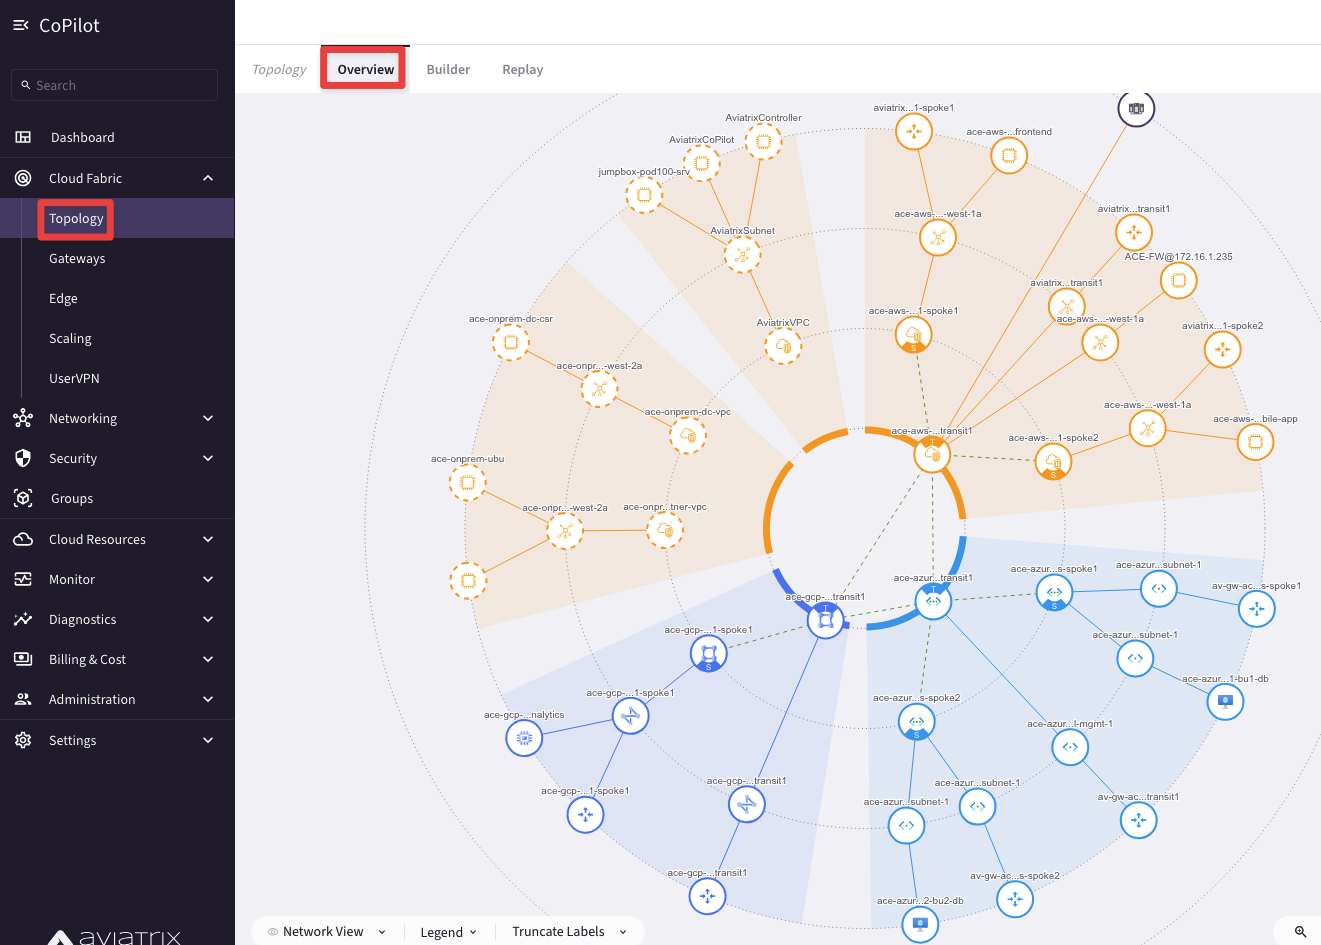
Fig. 7 Dynamic Topology#
Click on the "Managed" button on the right-hand side of the screen, for hiding the Unmanaged VPCs.
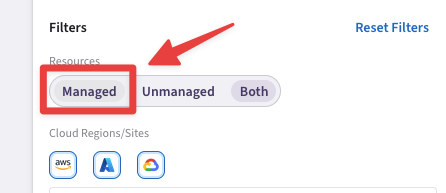
Fig. 8 Properties of your Topology#
Note
Managed VPC = Indicates an Aviatrix gateway is running in the VPC/VNet.
Unmanaged VPC = Indicates no Aviatrix gateways exist in the VPC/VNet.
After this action this is how your Topology should look like.
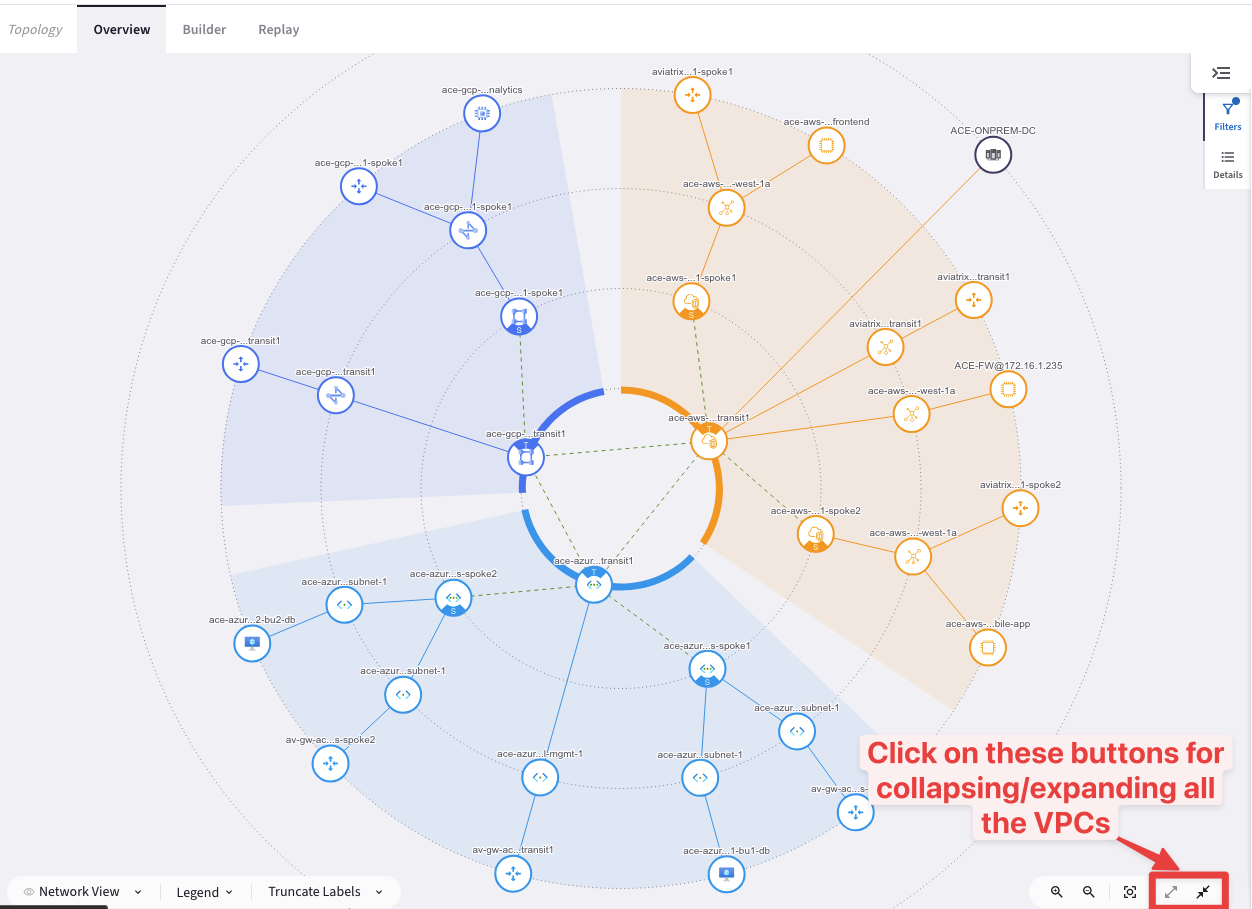
Fig. 9 Managed VPCs only#
Caution
Refer always to your personal POD for the IP addresses. The IP addresses visible on the subsequent screenshots are just examples taken from a different POD, used for creating the lab guides!
There are two methods for SSH to any instances inside the multicloud infrastructure of this lab:
Using an SSH client from your laptop (recommended method!).

Fig. 10 Public IP#

Fig. 11 DNS name#
Using the Apache Jumpbox from the POD Portal, for example if you are within your corporate network and tipically an outbound restriction rule is blocking the port 22.

Fig. 12 Jumpbox#
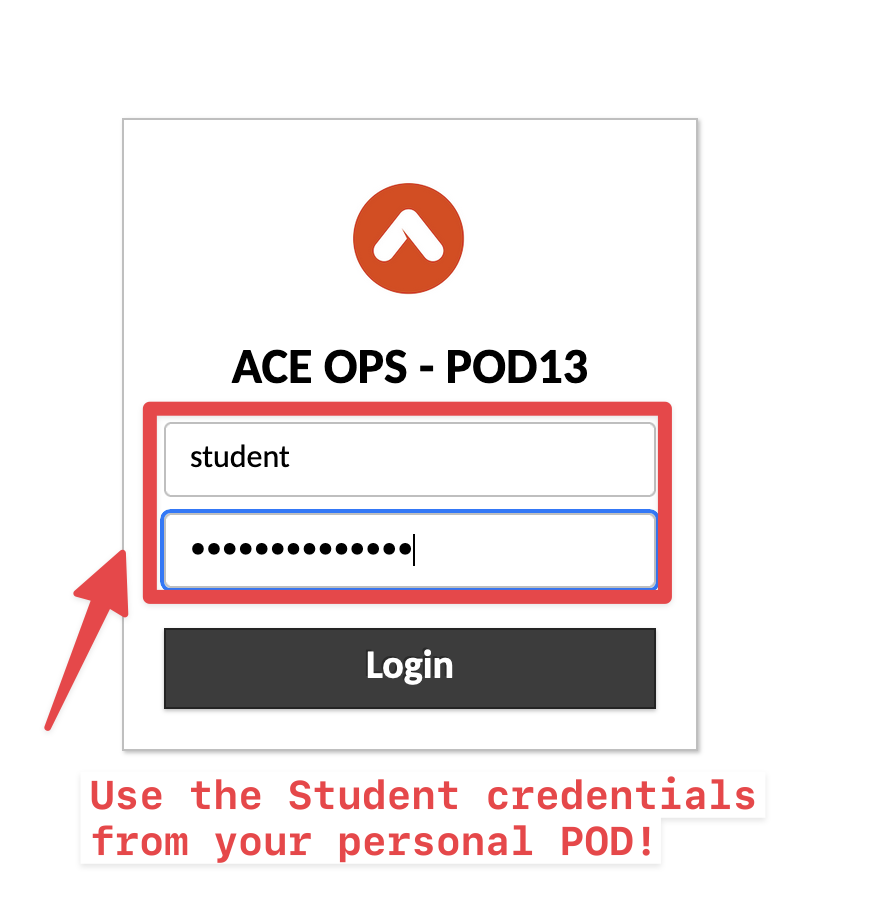
Fig. 13 Apache Guacamole Portal#
Note
Please bear in mind that if you decide to use the Jumpbox, Copy and Paste does not work directly from the host machine, therefore activate the Guacamole Menu, that is a sidebar which is hidden until explicitly shown. On a desktop or other device which has a hardware keyboard, you can show this menu by pressing Ctrl+Alt+Shift on Windows machine (Control+Shift+Command on Mac).
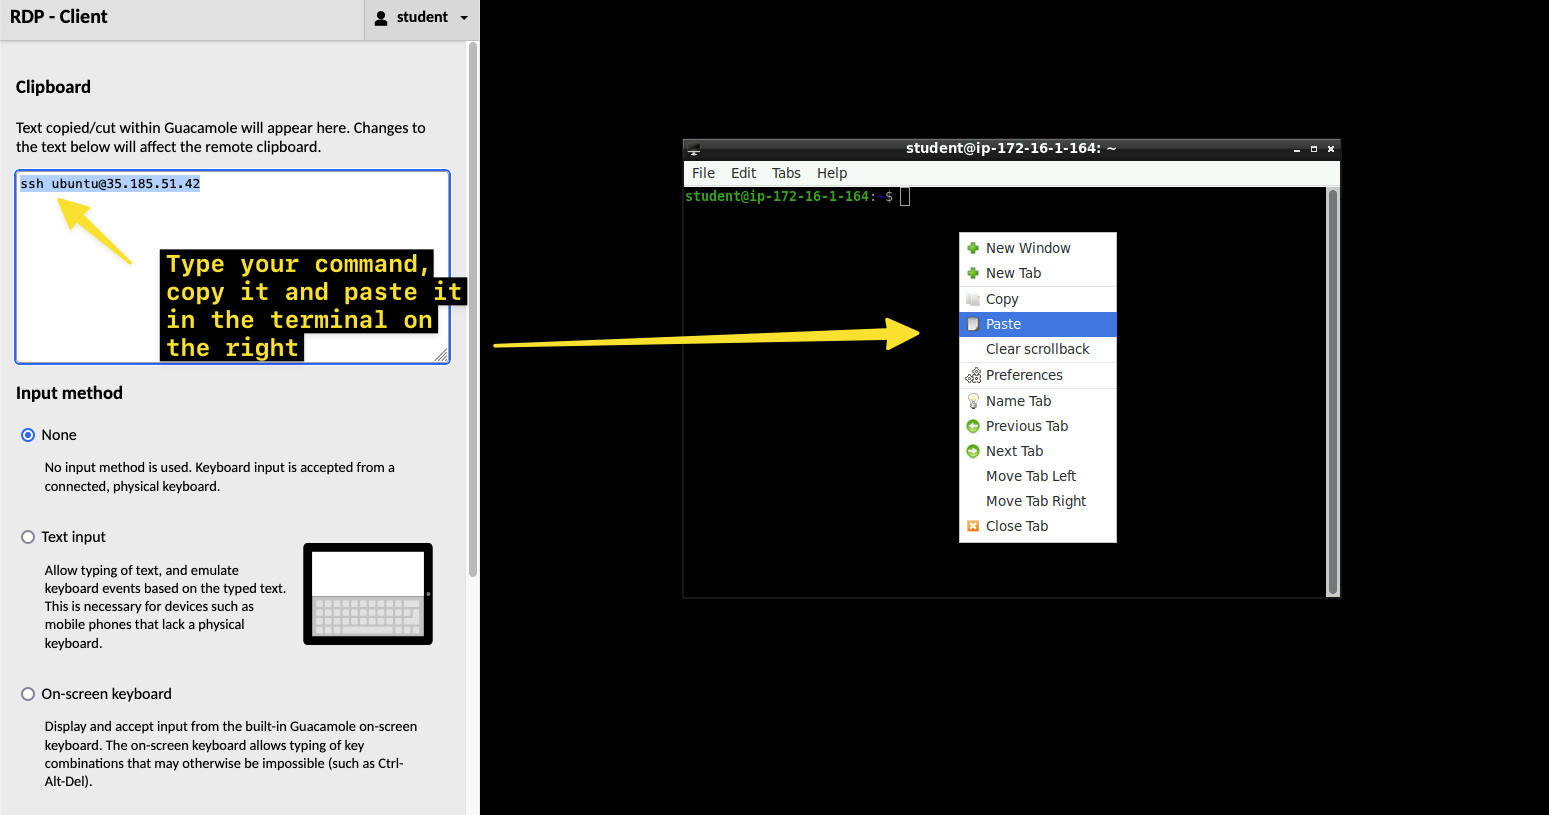
Fig. 14 Guacamole Menu#
Tip
The IP addresses can be easily retrieved using 3 different methods, as you like:
From the Properties section of each Virtual Machine on the Topology.
From the Virtual Machines Inventory.
From your personal POD portal, where you can also use the DNS symbolic names.
Dynamic Topology:
Expand the ace-aws-eu-west-1-spoke1 VPC and click on the test instance, then explore the "Properties" section on the right-hand side.
Caution
You can’t connect to any Aviatrix Gateways using the SSH protocol. The port 22 is hardened!
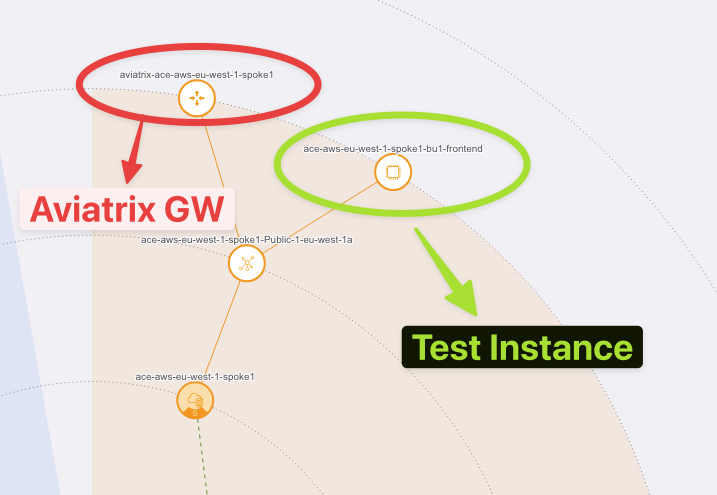
Fig. 15 EC2 Instance#
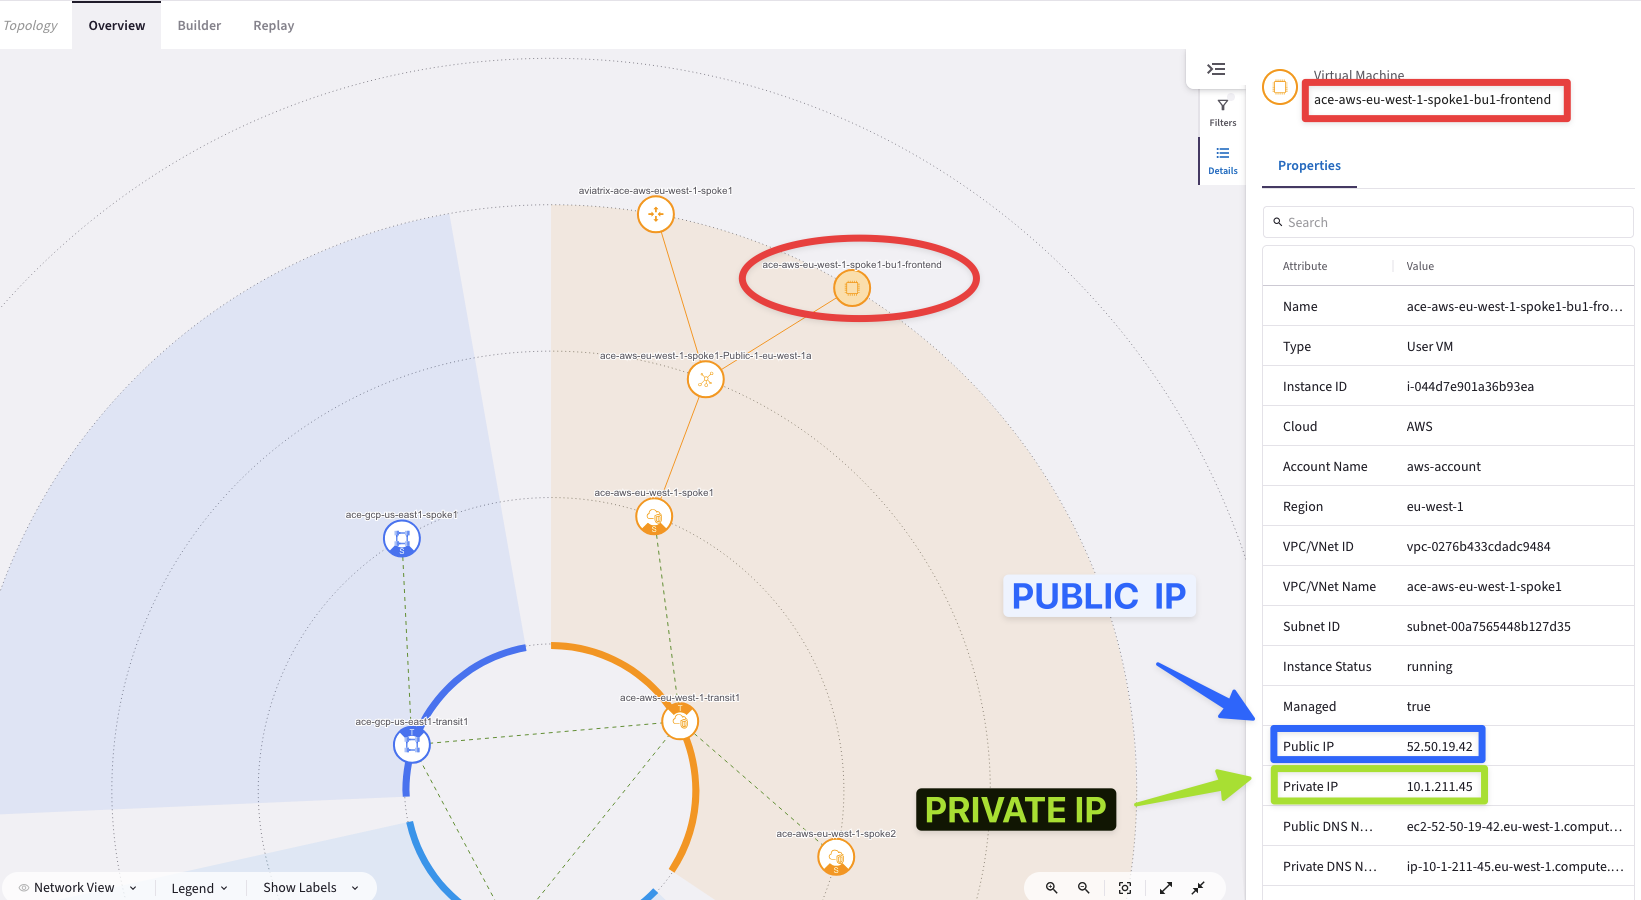
Fig. 16 Instance Properties#
Cloud Assets:
Go to CoPilot > Cloud resources > Cloud Assets > Virtual Machines and from here you can search for any instances and retrieve their IP addresses!

Fig. 17 Inventory#
POD Portal:
Use your personal POD in order to retrieve the symbolic names of any test instances.
Caution
Use the symbolic name that contains the word
"public"for logging to the instance from your laptop.Use the symbolic name that contains the word
"private"for the East-West traffic verification, once you have landed onto any test instances from your laptop.
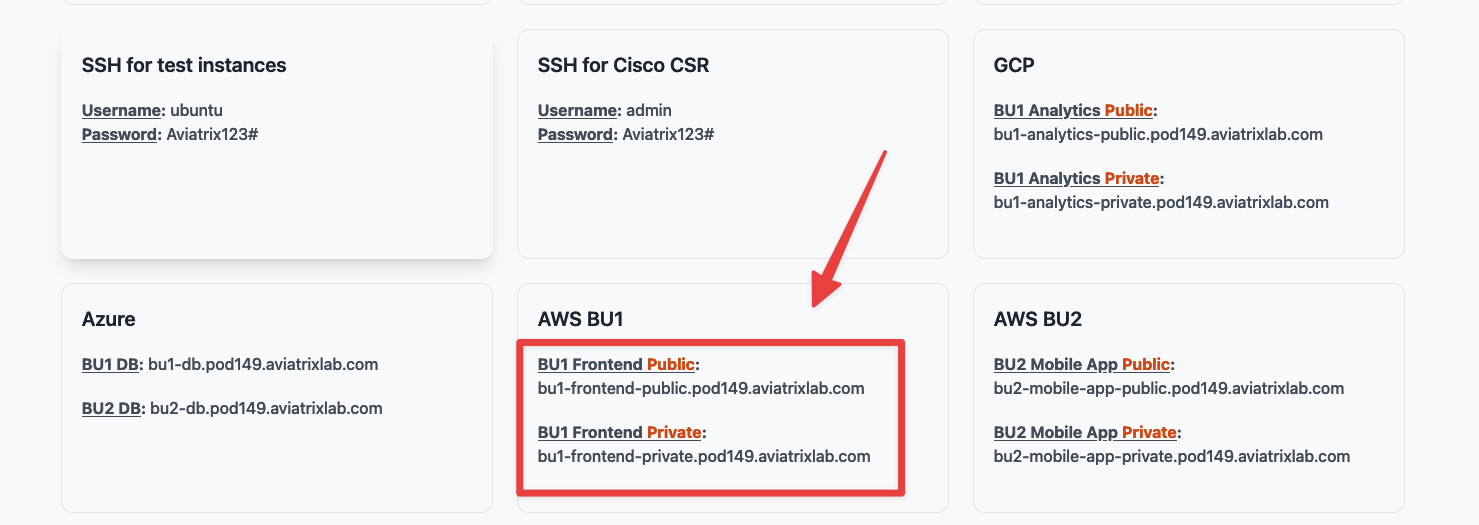
Fig. 18 DNS Names#
Verify connectivity between clients within the same BU:
SSH to the BU1 Frontend in AWS.
From BU1 Frontend ping the private IP address of the BU1 Analytics in GCP.
Ping and SSH will be successful within the same network domain!
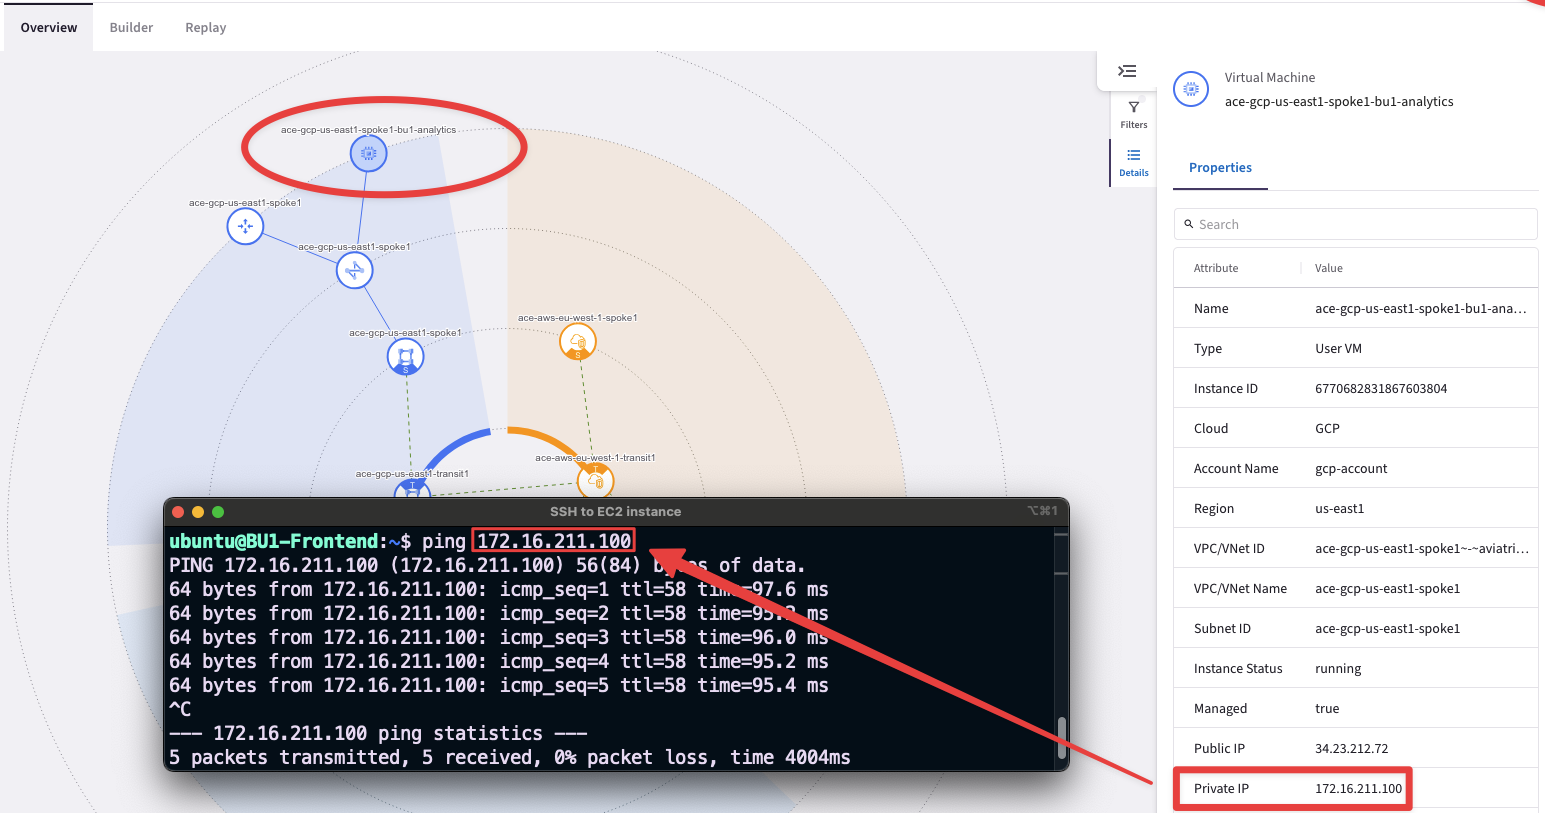
Fig. 19 BU1 connectivity#
Verify the network segregation between the two BUs:
From BU1 Frontend try to ping the private IP address of the BU2 Mobile App.
From BU1 Frontend try to SSH BU2 Mobile App (use its Private IP address!).
Ping and SSH commands should not work this time, due to the separation between the two segments (i.e. these are two different Routing Domains).
Important
Once again refer always to your personal POD for the IP addresses.
The screenshots are used as examples and might indicate different IP addresses from those shown on your personal POD portal!

Fig. 20 BU1 to BU2 fails#
Check the Network Segmentation section on the CoPilot, and then look at the Logical View.
Tip
Go to CoPilot > Networking > Network Segmentation > Overview
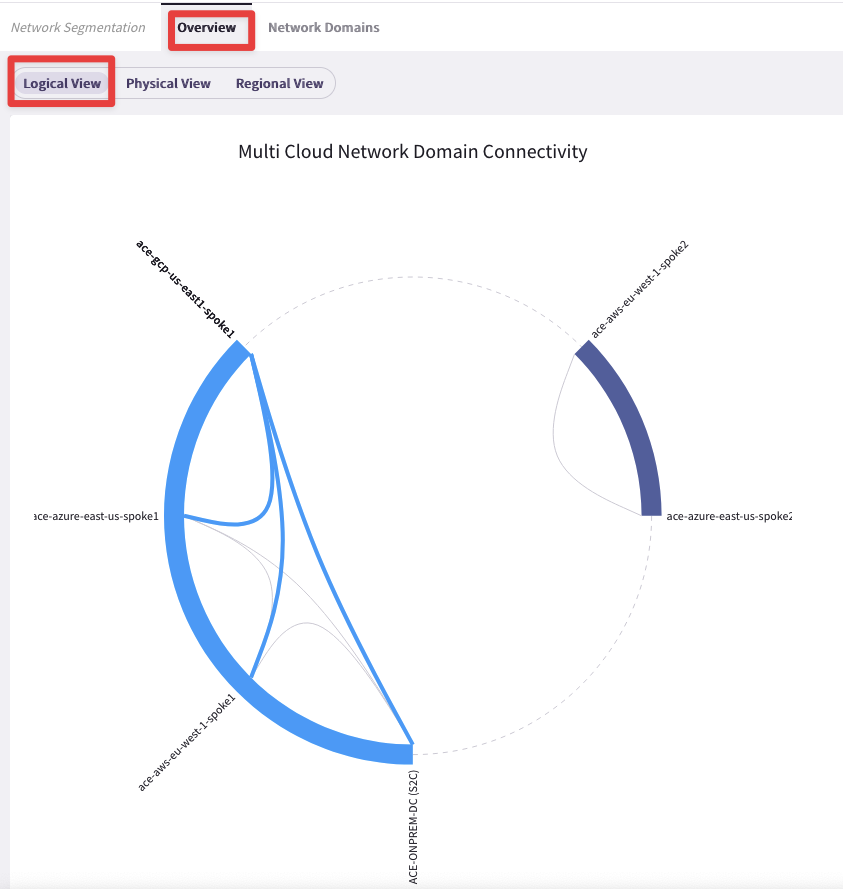
Fig. 21 Logical View#
Check the Network Domains Tab, too.

Fig. 22 Network Domains#
Check the different routing tables (VRFs) maintained by any of the Transit Gateways.
Tip
Go to CoPilot > Cloud Fabric > Gateways > Transit Gateways > select the ace-aws-eu-west-1-transit Gateway > Gateway Routes and filter out based on any Network Domains (i.e. either BU1 or BU2).
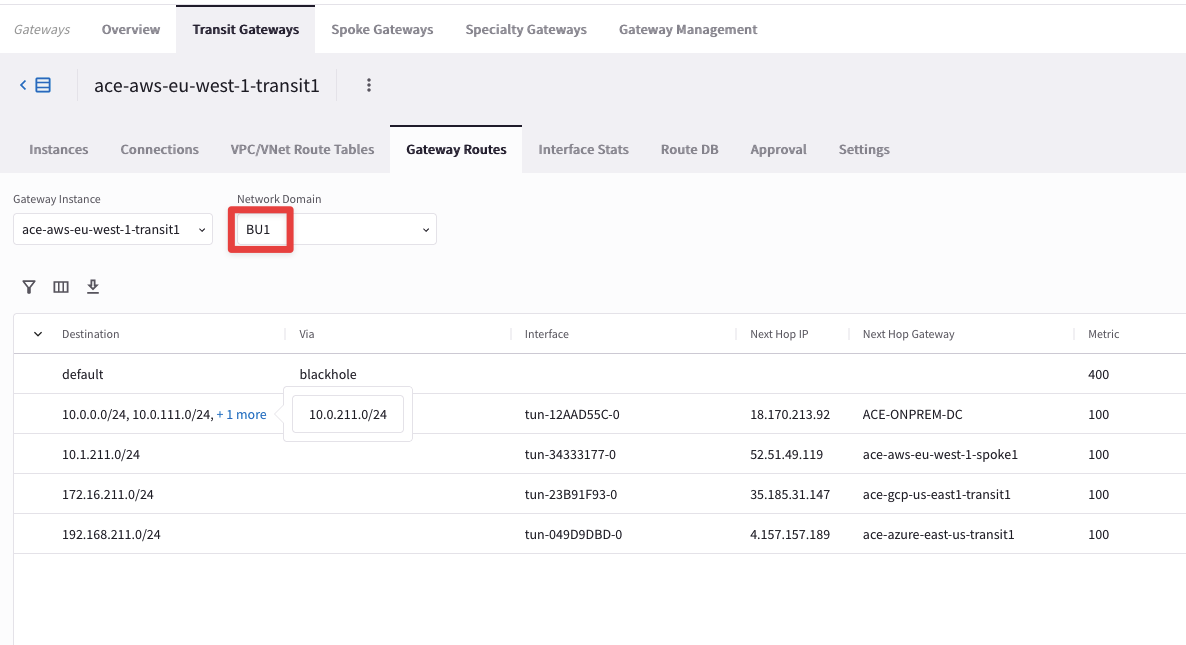
Fig. 23 Network Domain (aka VRF)#
Tip
Go to CoPilot > Cloud Fabric > Gateways > Transit Gateways > select the ace-aws-eu-west-1-transit Gateway and then select the tab Route DB.
You will notice that the Segmentation feature is indeed enabled. Moreover, you will notice the different RTBs.
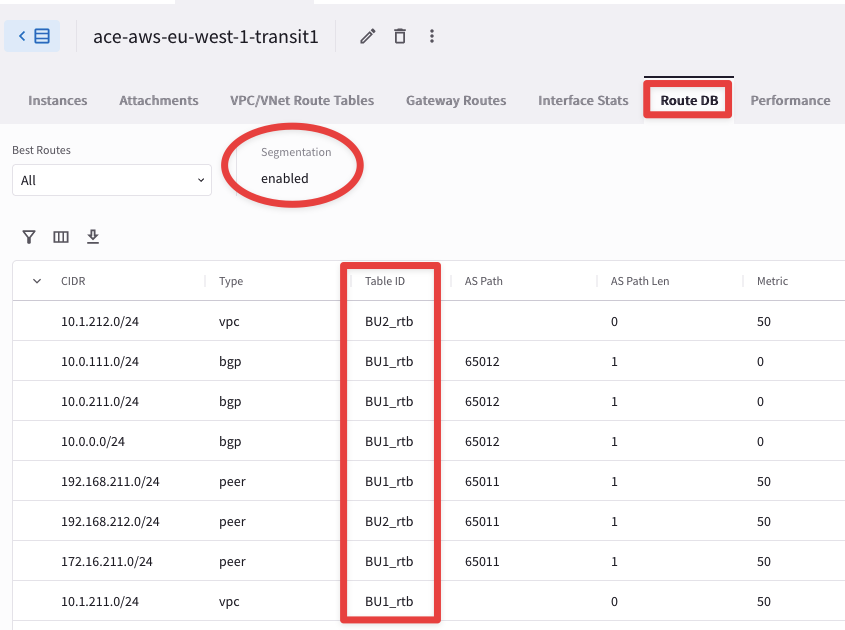
Fig. 24 RIB#
Use the FlowIQ functionality from the CoPilot, for inspecting the NetFlow Data.
Tip
Go to CoPilot > Monitor > FlowIQ, click on the "+" icon and filter based, for instance, on the "Destination IP Address" 172.16.211.100 (i.e. BU1 Analytics).
Do not forget to click on Apply.

Fig. 25 FlowIQ Filter#
Then check the "Flow Exporters" widget, then from the drop-down menu select the "Aviatrix Gateway" widget: you will see the list of all the Aviatrix Gateways involved along the path.
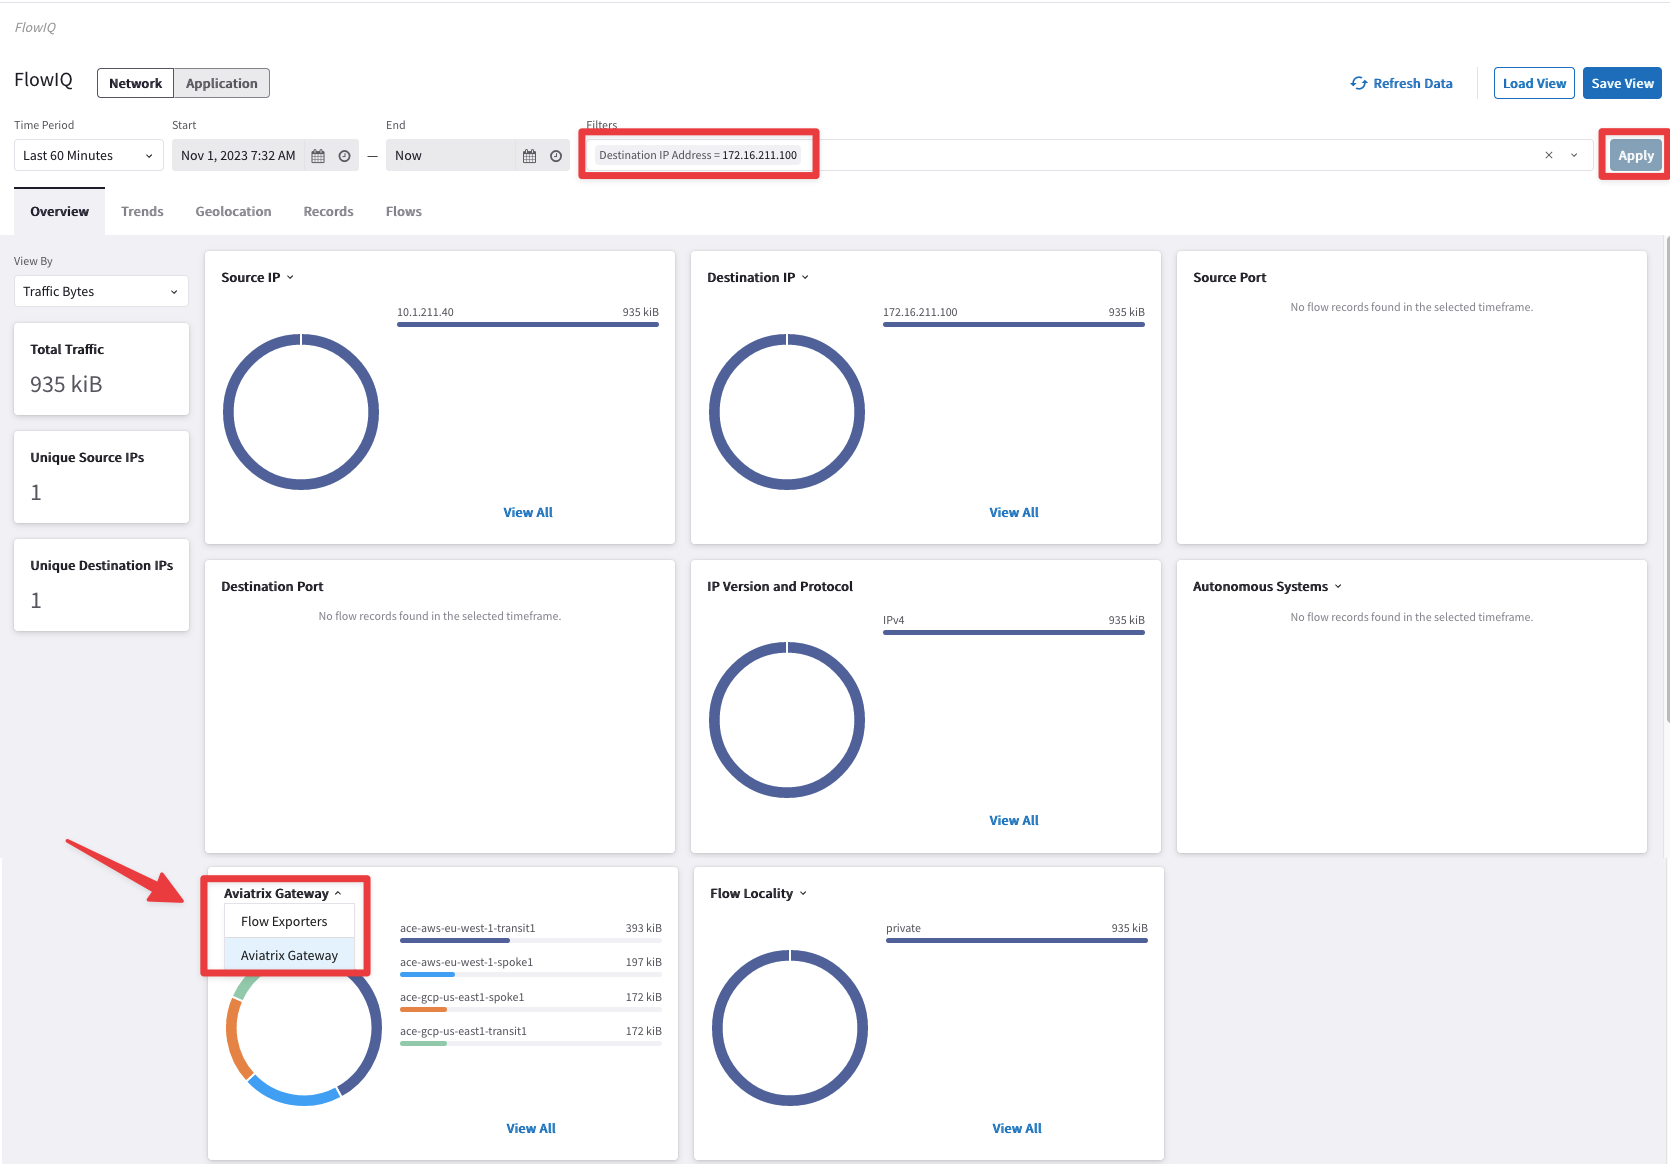
Fig. 26 FlowIQ#
Note
On the Aviatrix Gateway widget, the very first gateway from the list is the gateway with the highest traffic (in KibiBytes).
Use Cloud Routes for pinpointing the originator of the route 172.16.211.0/24.
Tip
Go to CoPilot > Diagnostics > Cloud Routes, search for the subnet 172.16.211.0/24 on the search field and then filter based on the following condition: “Gateway contains spoke1”.
The filter button is on the left-hand side of the screen and is shaped like a small funnel.

Fig. 27 Search field and Filter icon#
Tip
The Originator has the egress interface that corresponds to the eth0 interface (i.e. the LAN interface), which in turn means, direct connected.
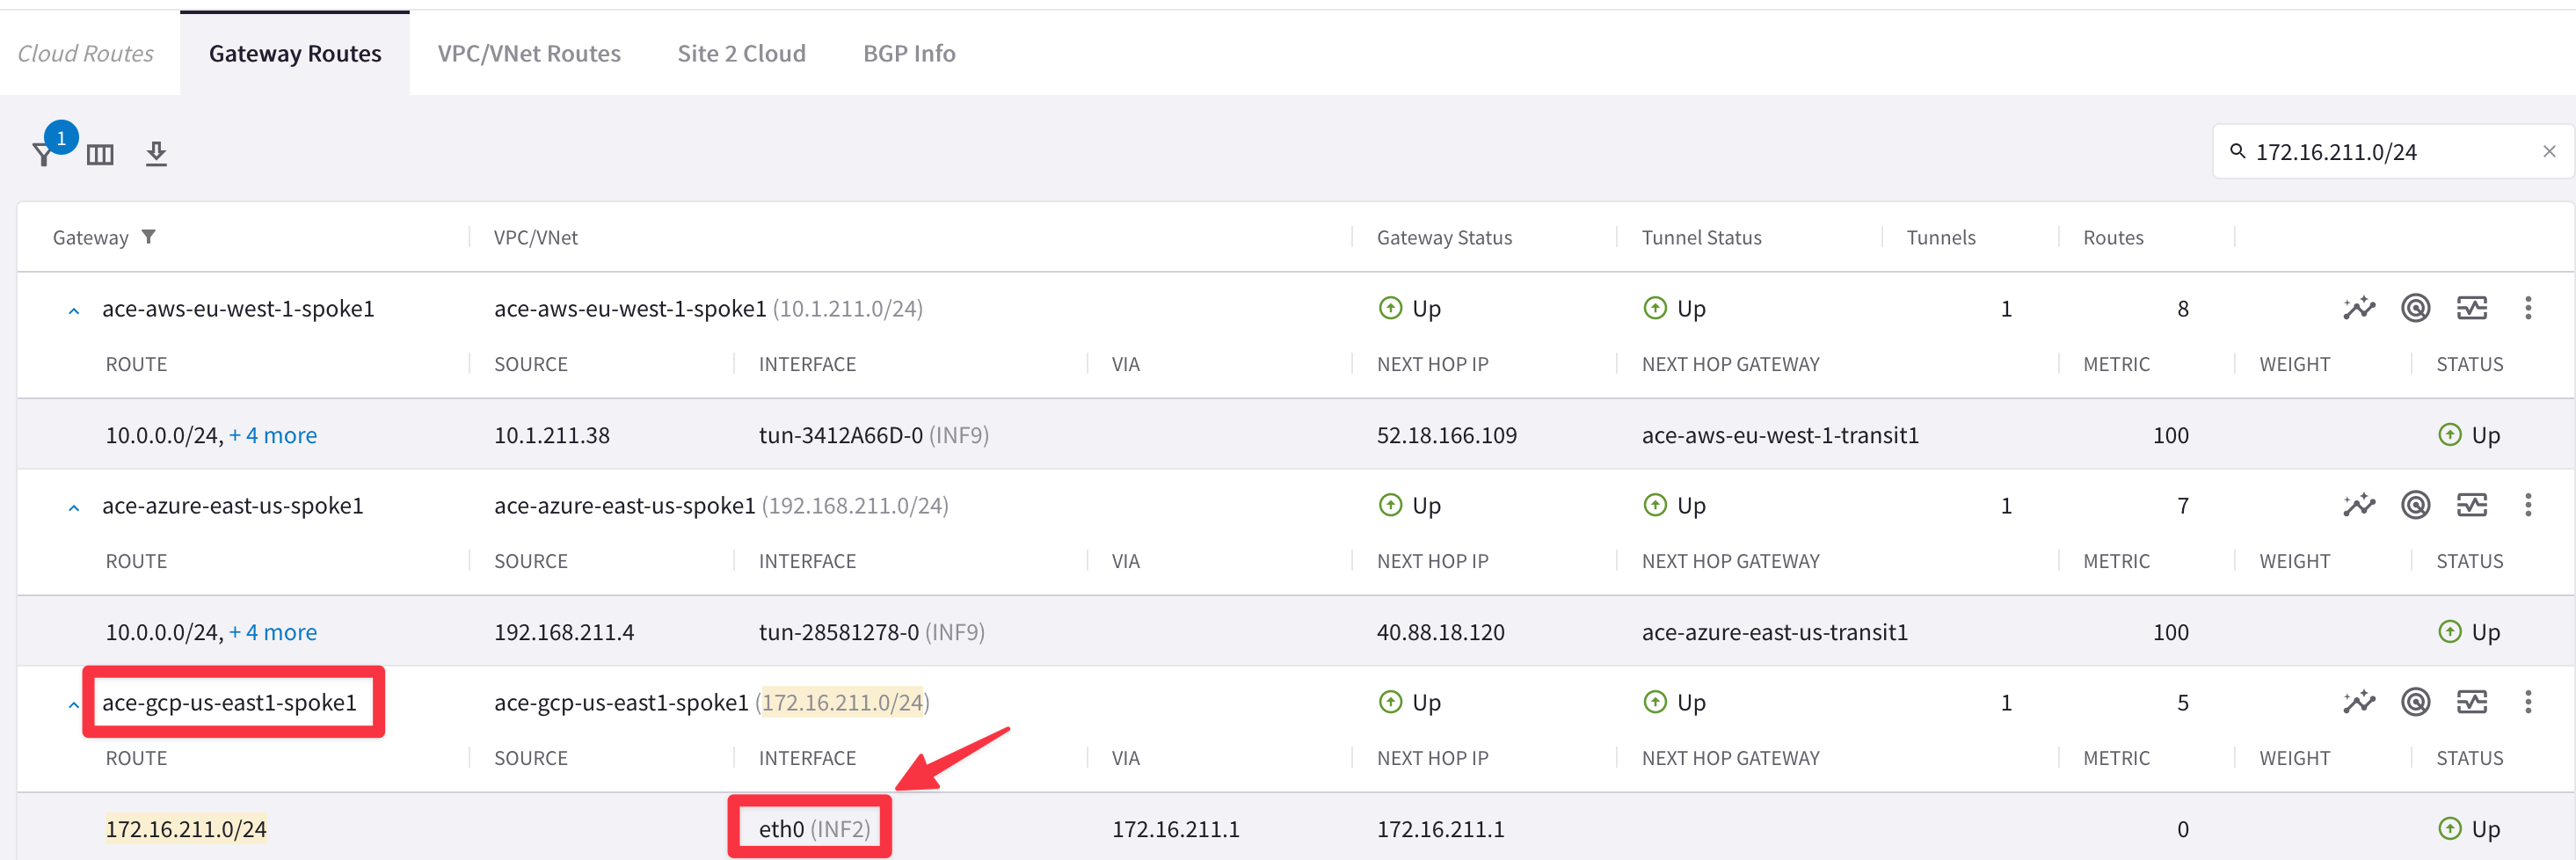
Fig. 28 Originator = eth0#
Use Cloud Routes for pinpointing the originator of the route 10.0.0.0/24.
Tip
Go to CoPilot > Diagnostics > Cloud Routes and search the subnet 10.0.0.0/24 on the search field.
Remove any previous filters!
This time you need to proceed with a recursive lookup: from any Spoke GWs check the NEXT HOP GATEWAY column and try to find the originator of 10.0.0.0/24.
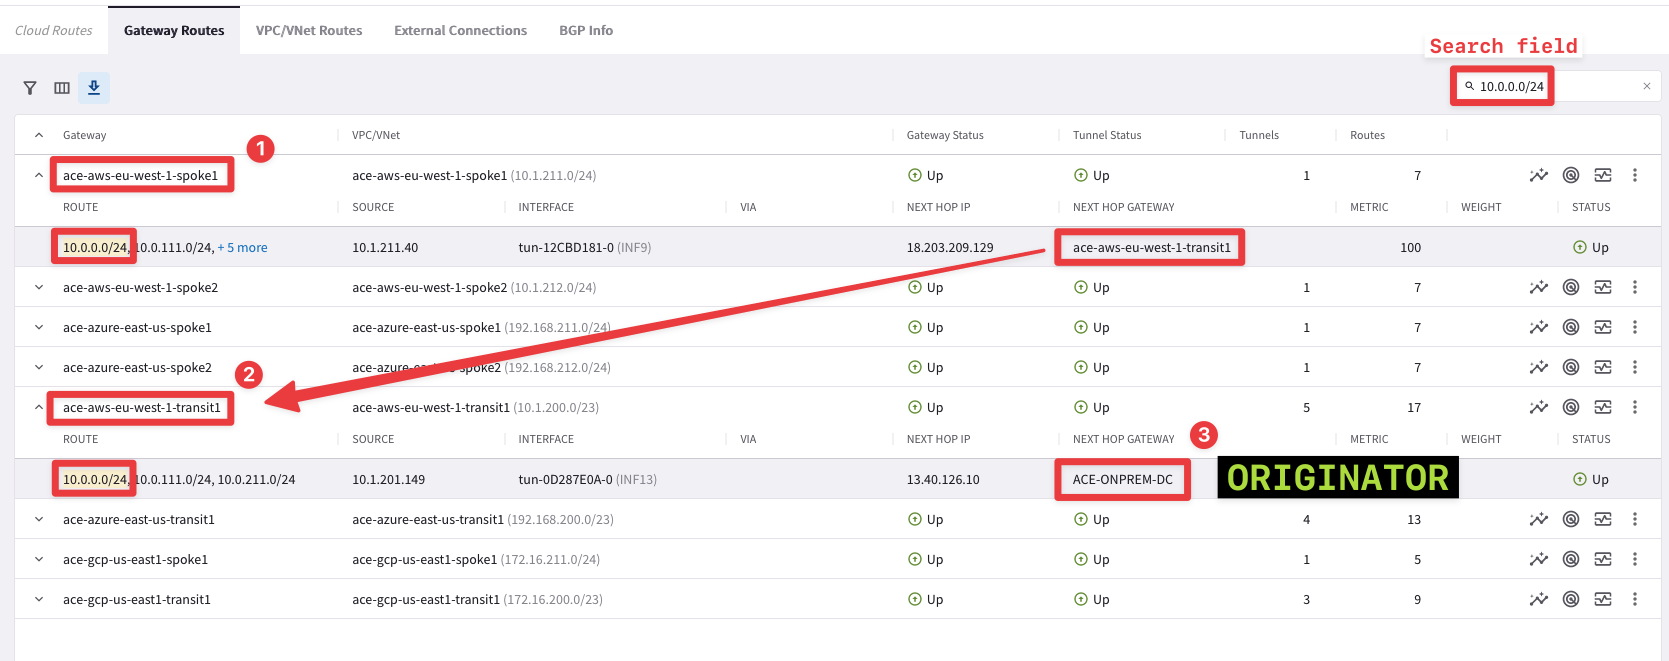
Fig. 29 Cloud Routes - Recursive lookup#
