Lab 9 - THREATIQ & COSTIQ#
1. Objective#
This lab will demonstrate how ThreatIQ works.
2. ThreatIQ Overview#
Aviatrix Gateways send NetFlow data to CoPilot. CoPilot uses this data in many ways. FlowIQ is one. ThreatIQ is another. ThreatIQ alerts you on Malicious IPs with bad reputations, but then can also apply an enforcement. These IPs are reported in the ThreatIQ database that CoPilot maintains.
Important
ThreatIQ protect all the Aviatrix Gateways and it relies on a well-known database, provided by Proofpoint.
3. Topology#
In this lab, we will deploy a “PSF" gateway in AWS US-EAST-1 region, to protect the public subnet.
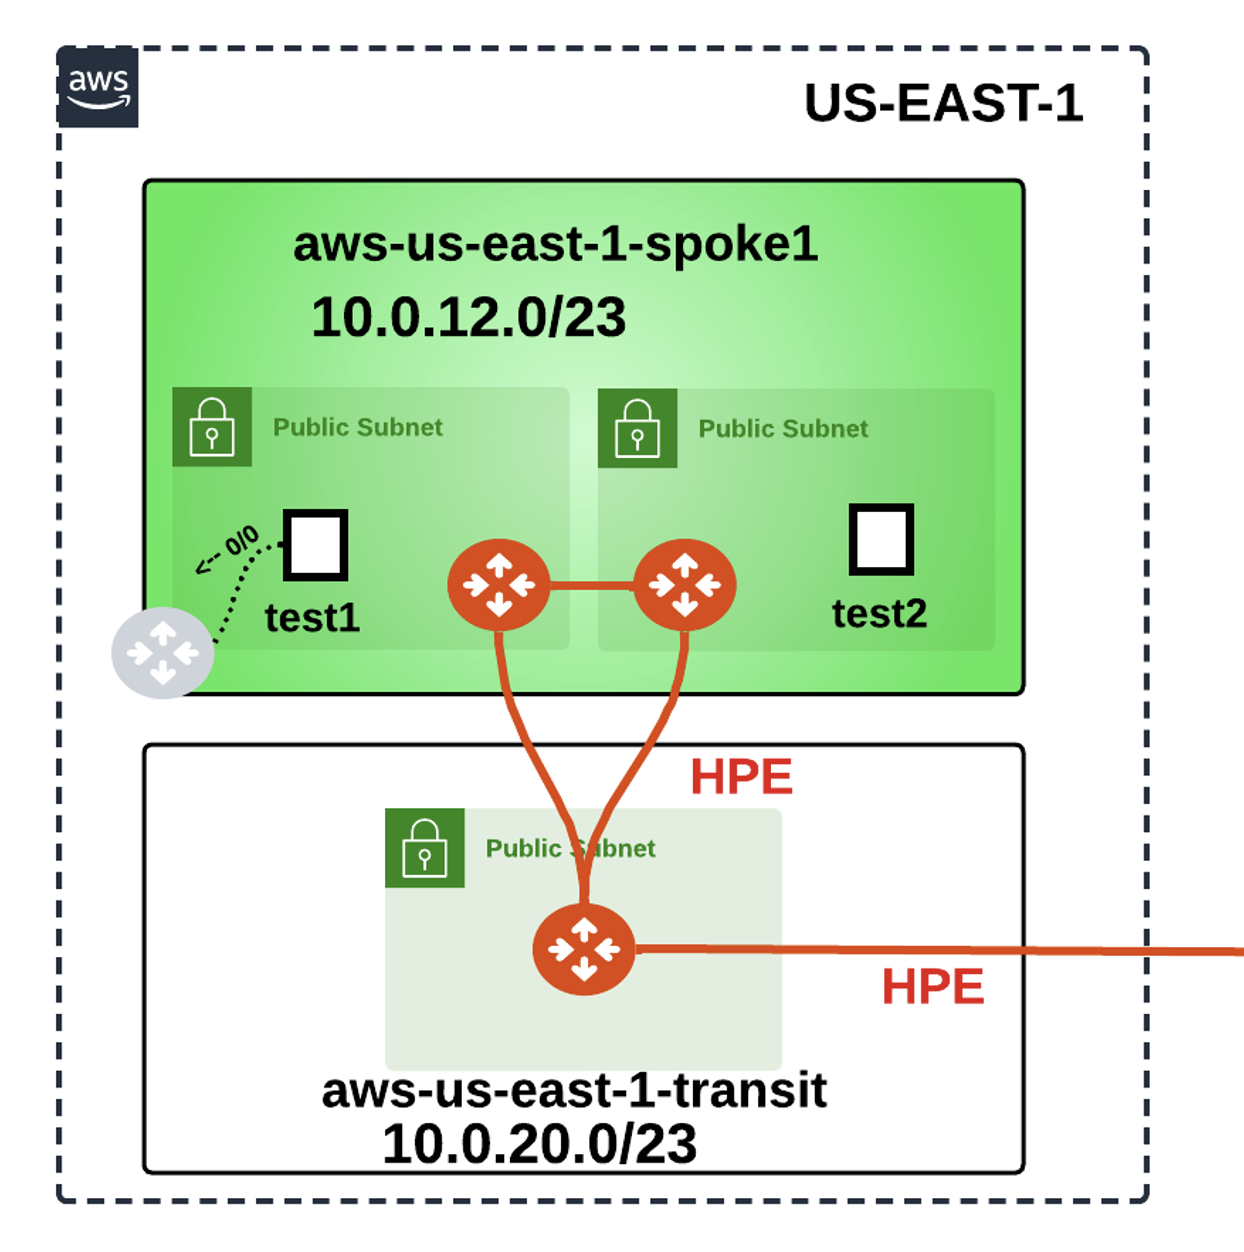
Fig. 306 Lab 9 Initial Topology#
4. PSF#
4.1 Deploy the PSF#
Go to CoPilot > Cloud Fabric > Gateways > Specialty Gateways, then click on the “+Gateway" button and then choose the Public Subnet Filtering Gateway.

Fig. 307 PSF#
Insert the following parameters:
Name: aws-us-east-1-psf
Account: aws-account
Region: us-east-1 (N. Virginia)
VPC: aws-us-east1-spoke1
Instance Size: t2.medium
Attach to Unused Subnet: us-east-1a
Route Table: aws-us-east1-spoke1-Public-1-us-east-1a-rtb
Do not forget to click on Save.
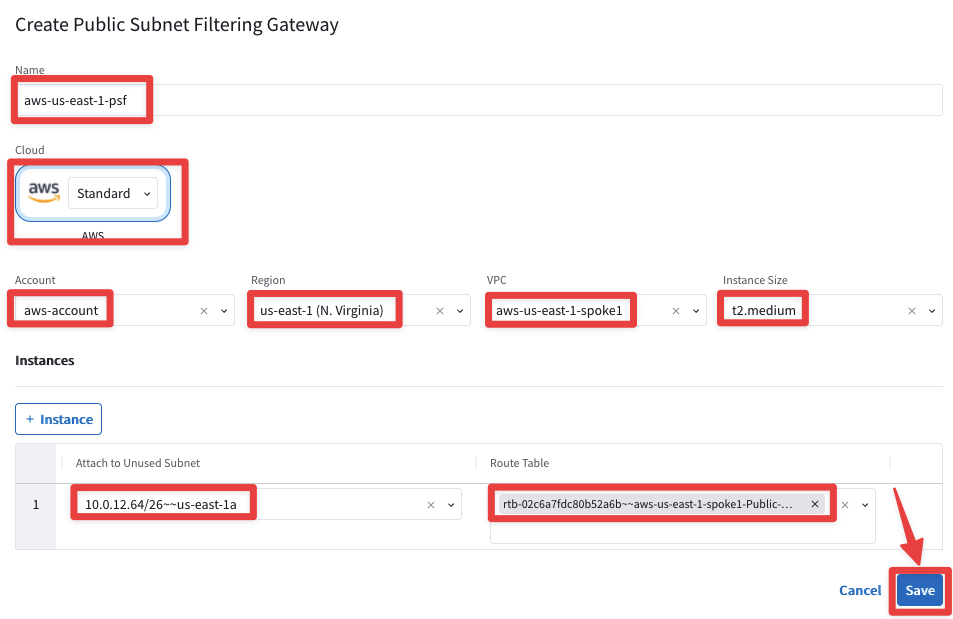
Fig. 308 PSF template#
Warning
Wait for about 8 minutes for the completion of the PSF deployment.

Fig. 309 PSF deployment in progress#
4.2 RTB verification#
Click on the PSF gateway, select the VPC/VNet Route Tables and then inspect the aviatrix-Aviatrix-Filter-Gateway Route Table

Fig. 310 PSF deployed#
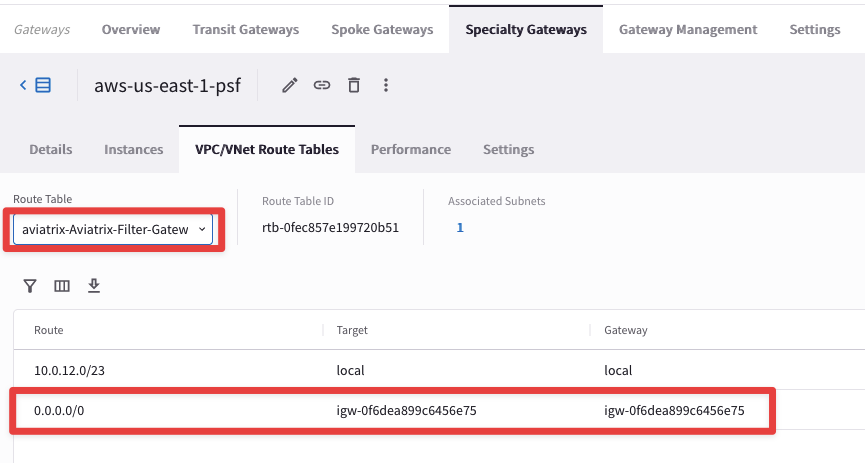
Fig. 311 PSF rtb#
Note
The subnet with the PSF gateway is a Public Subnet with 0/0 pointing to IGW. No workload instances should be deployed in this subnet.
Verify one more routing table that we selected while deploying the PSF Gateway: aws-us-east1-spoke1-Public-1-us-east-1a-rtb. You can notice that the default route is pointing towards the PSF Gateway (we are verifying this rtb because the test instance’s subnet points to this rtb).
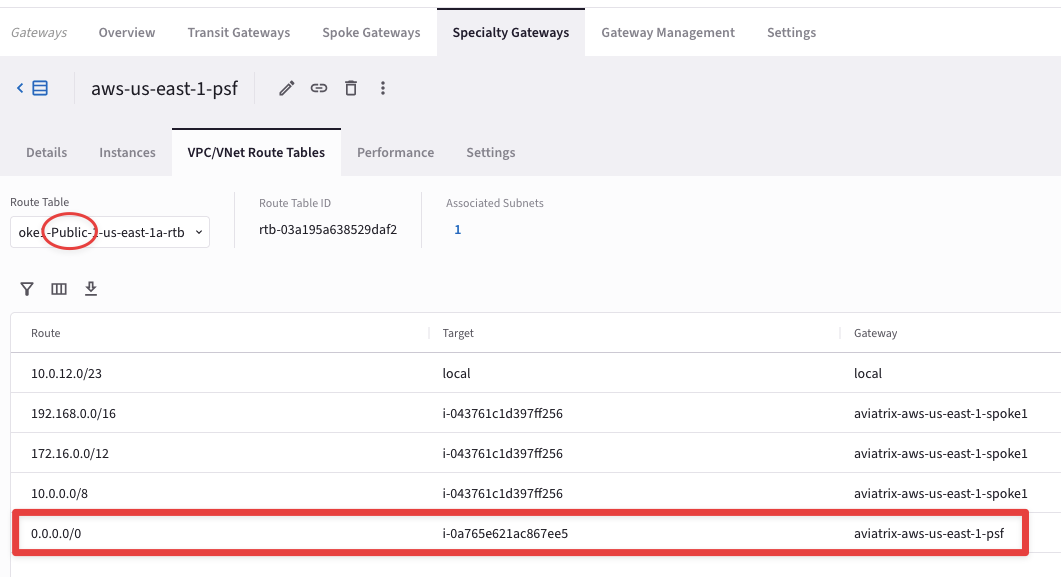
Fig. 312 aws-us-east1-spoke1-rtb-public-a#
5. Enable ThreatIQ#
Navigate to CoPilot > Security > ThreatIQ > Configuration
Click on Send Alert:
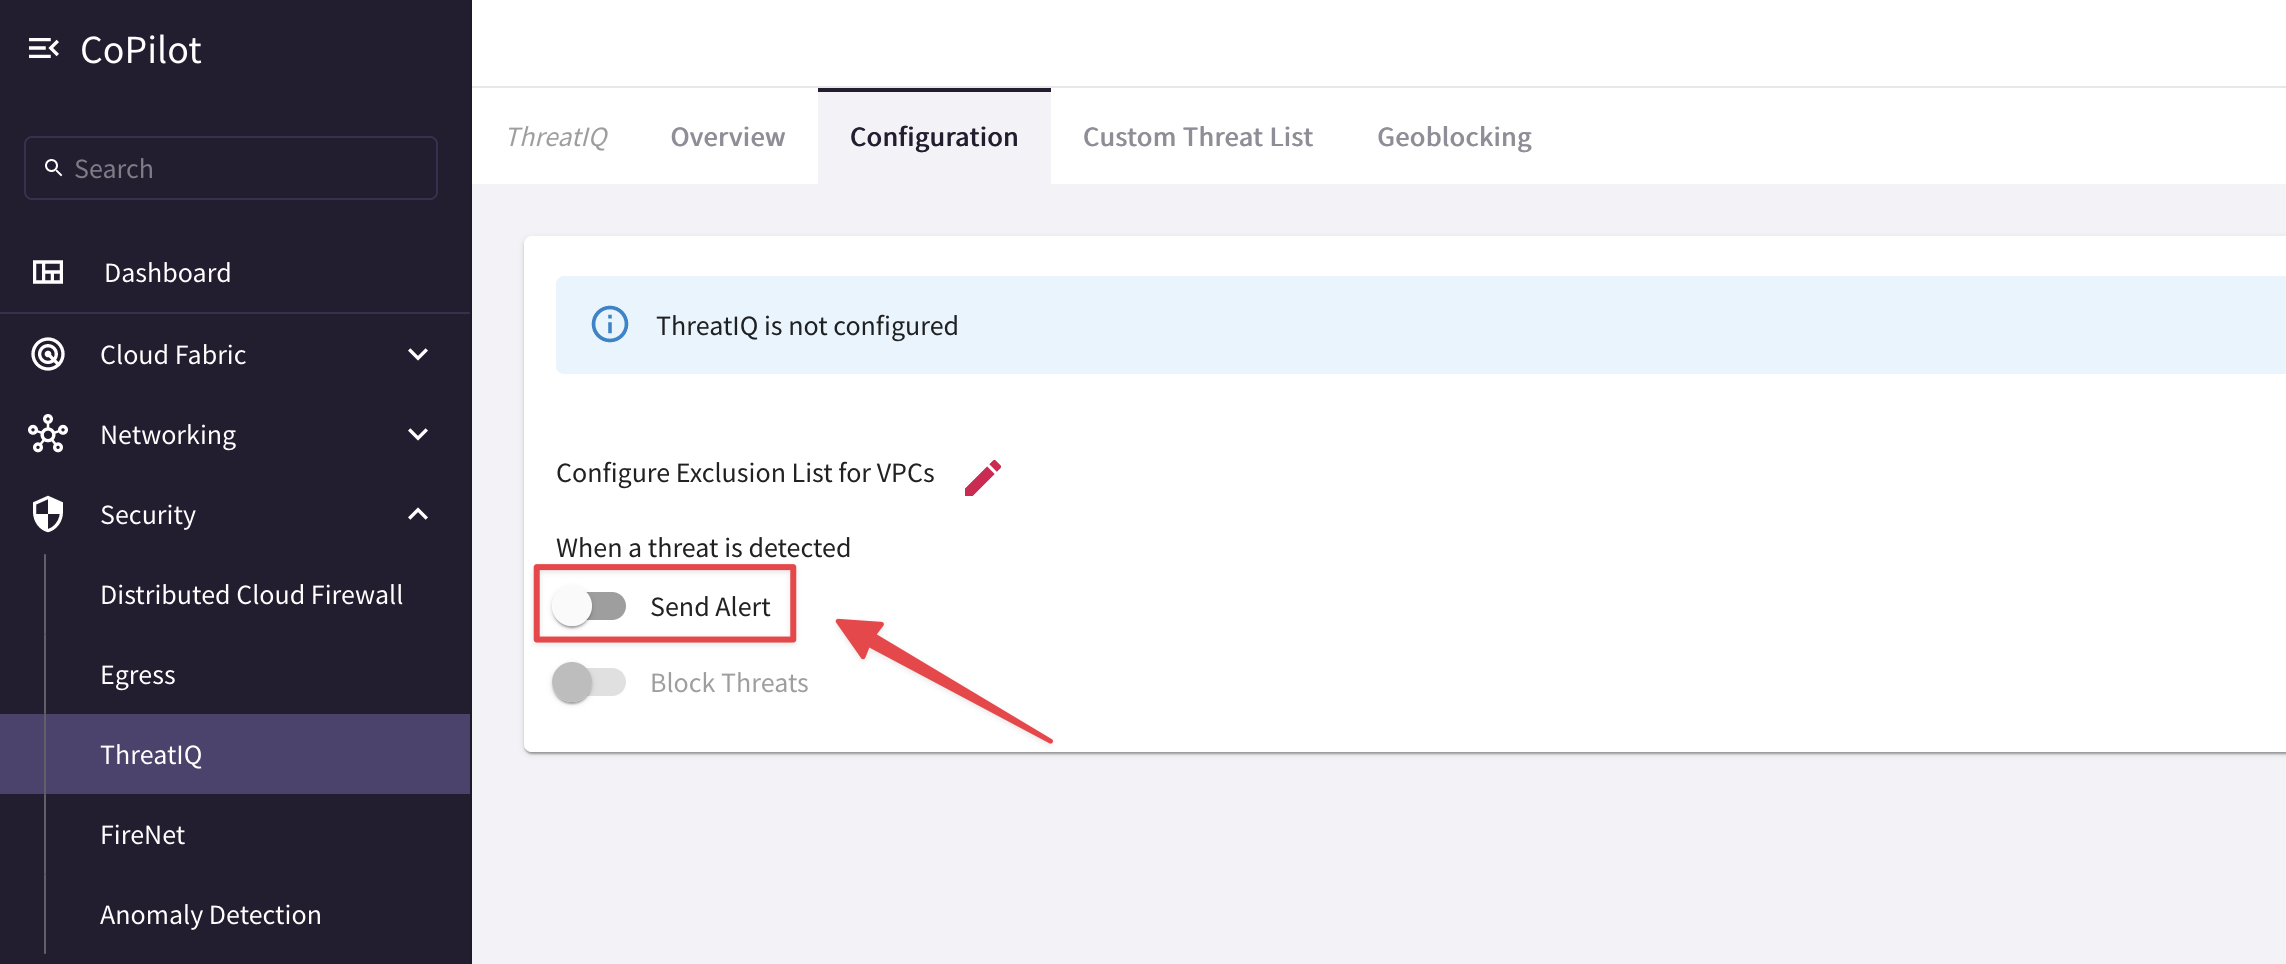
Fig. 313 Enable ThreatIQ#
Then click on Notification Settings.
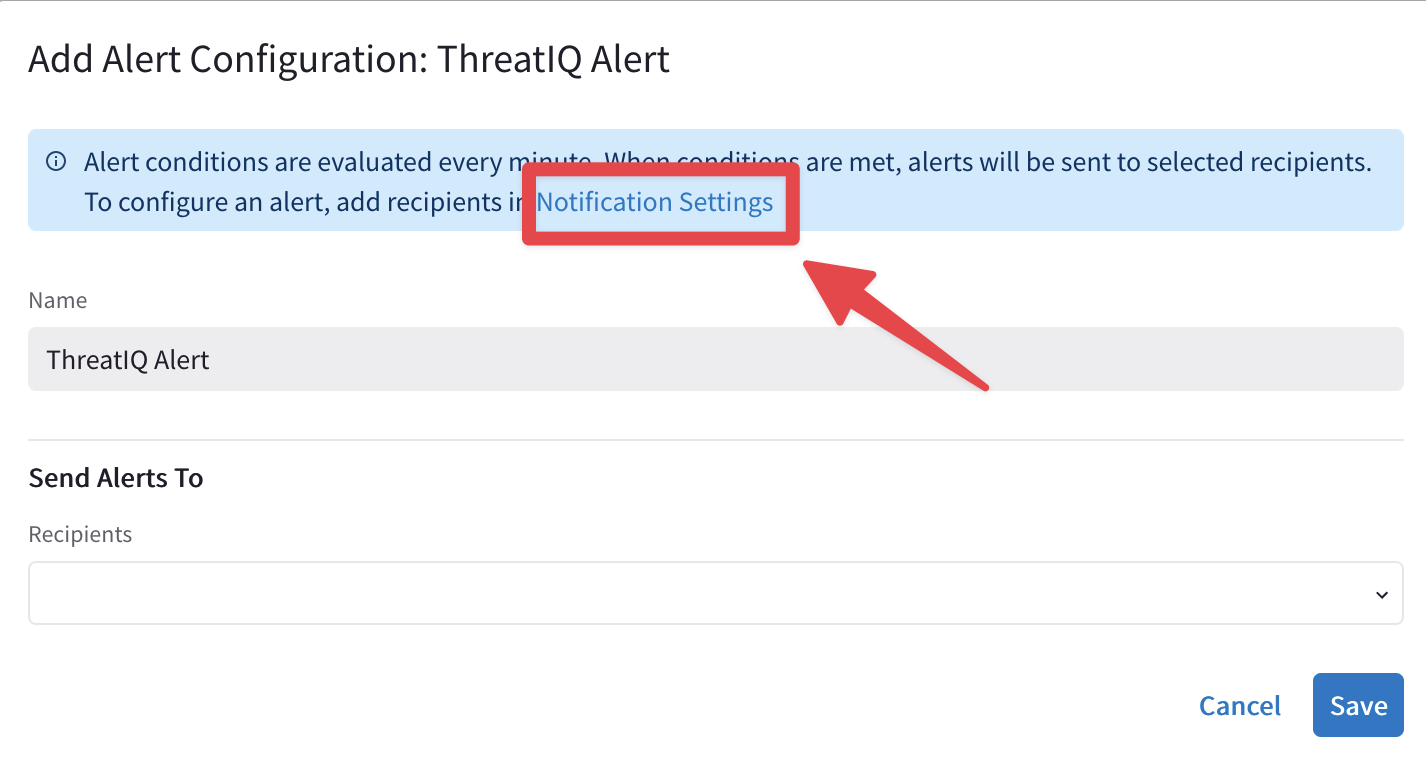
Fig. 314 Notification Settings#
Now click on the "+ Email Address" button.
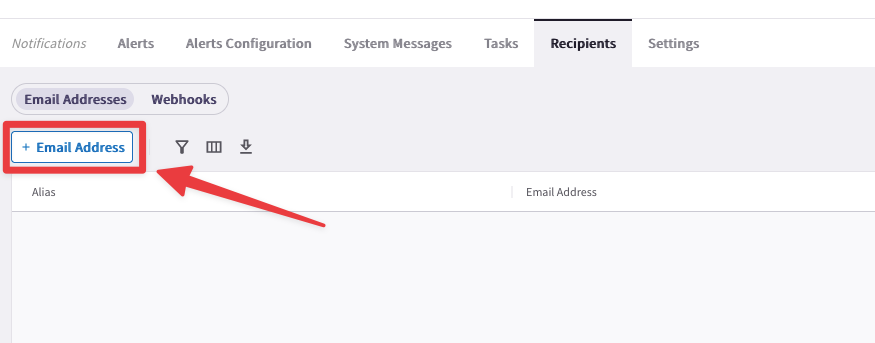
Fig. 315 Email#
Choose an alias, insert your personal email and then click on Save:
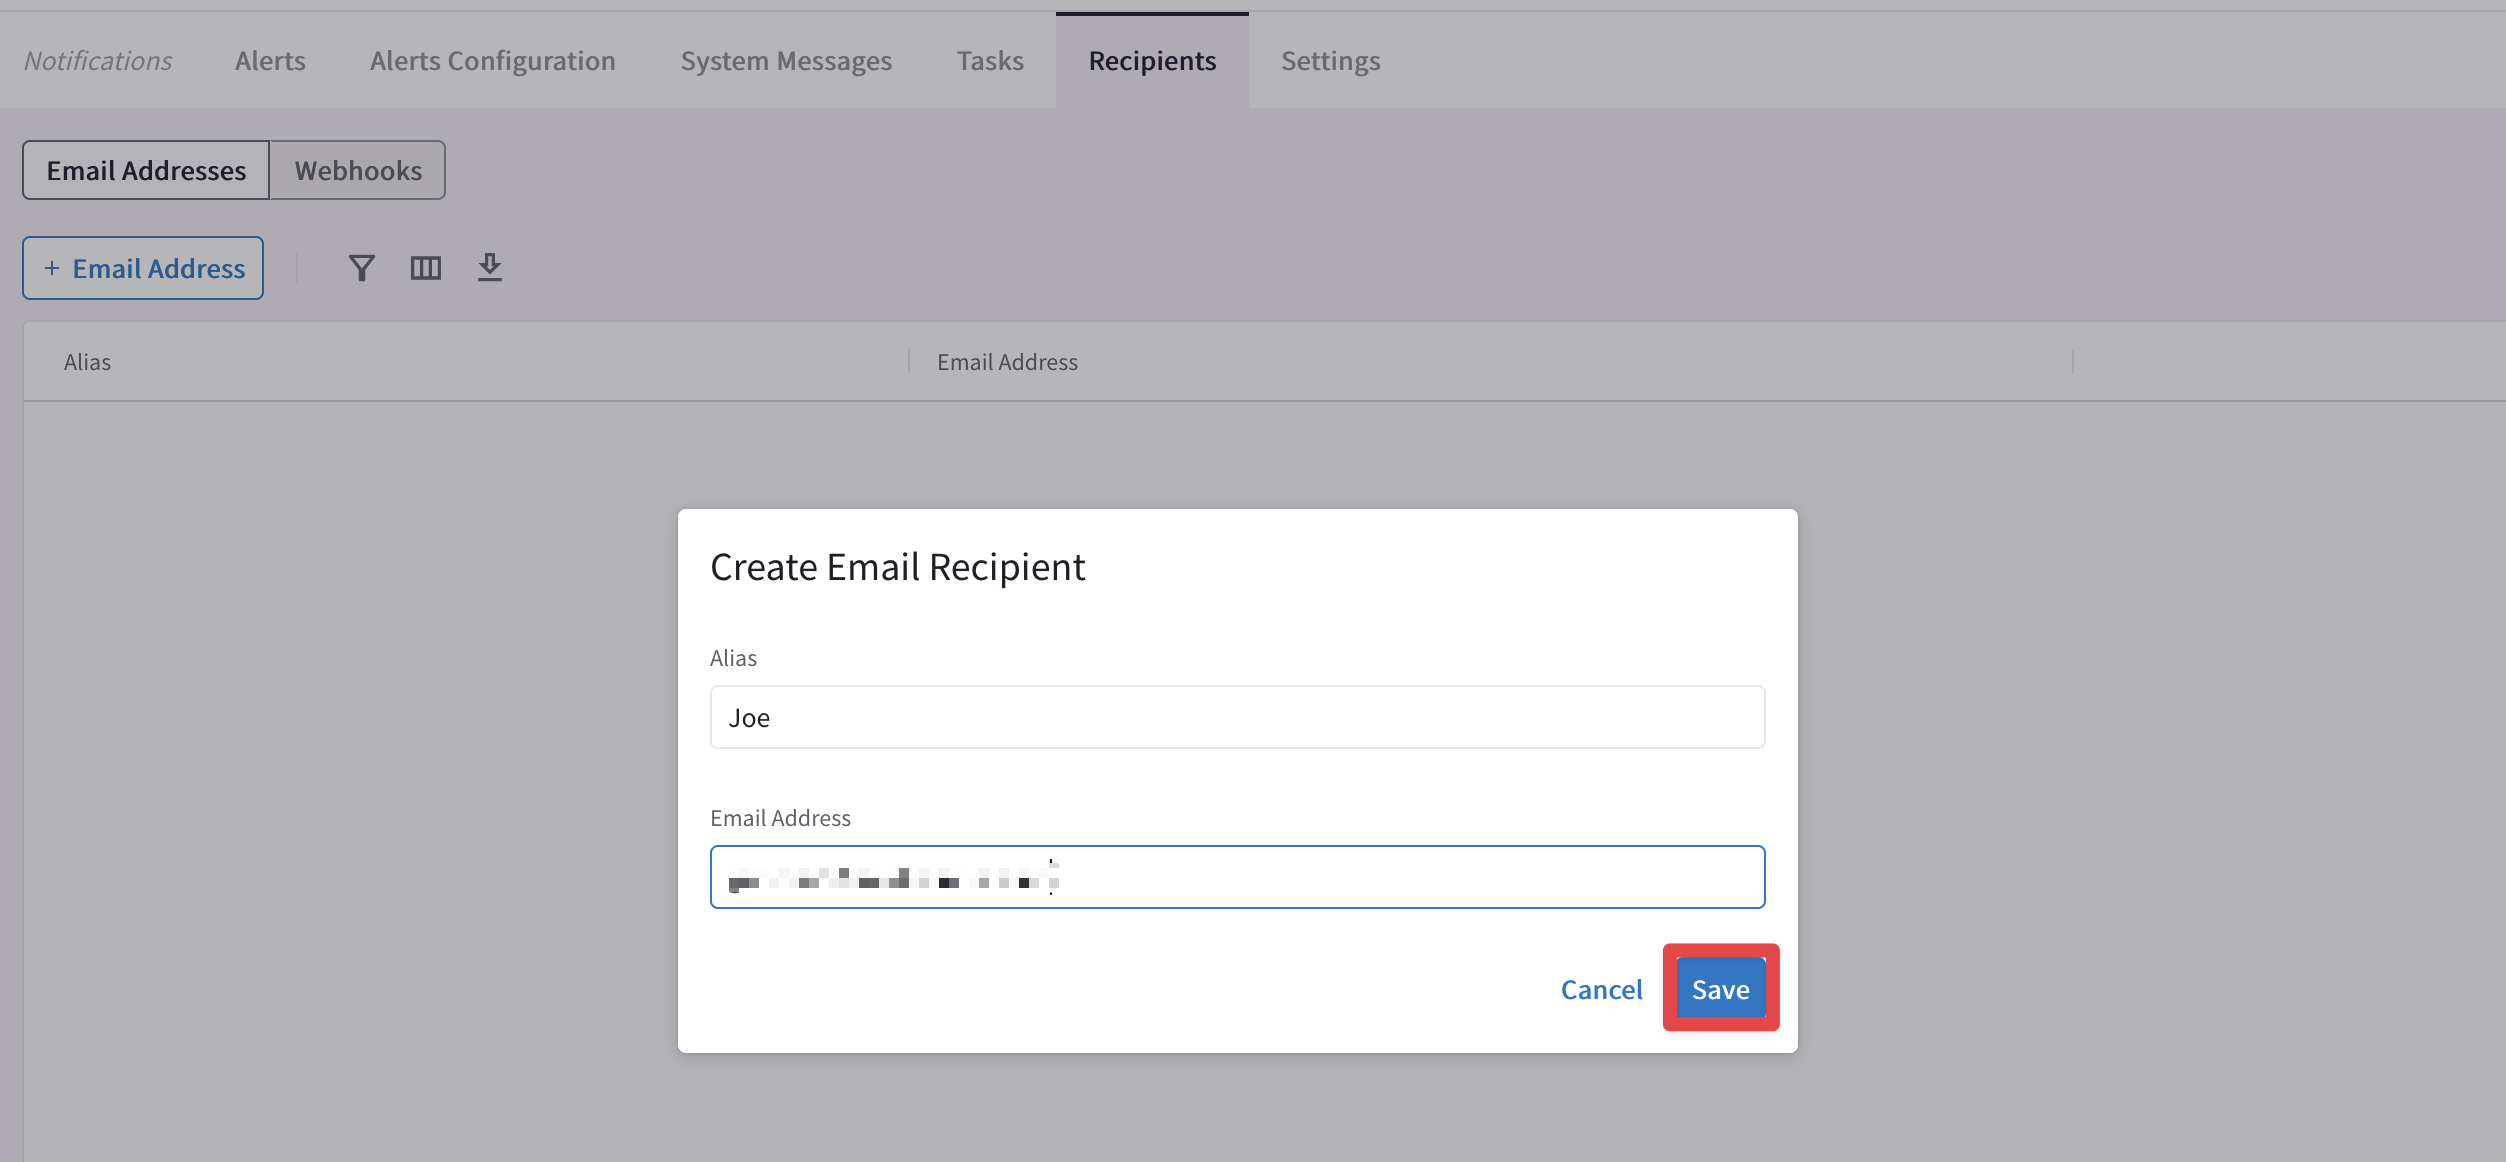
Fig. 316 Alias and Personal Email#
Navigate back to CoPilot > Security > ThreatIQ > Configuration
Click again on Send Alert:
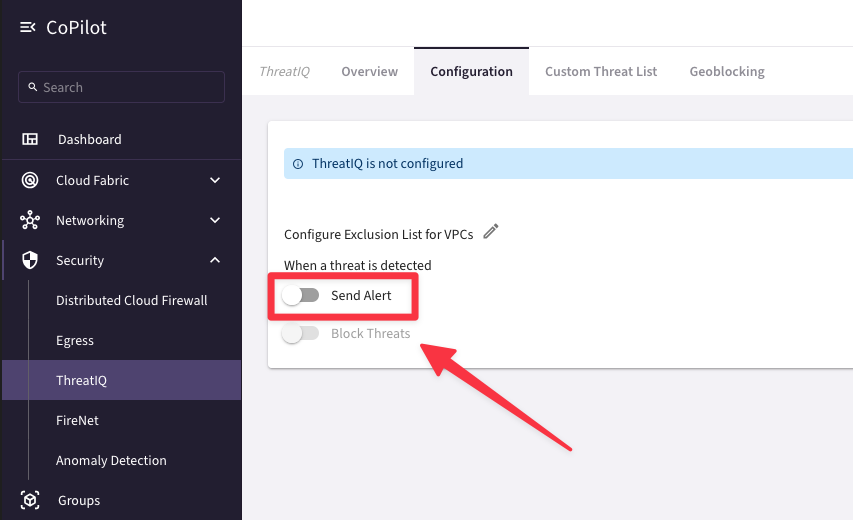
Fig. 317 Send Alert Settings#
Select the alias that was previously created from the drop-down window "recipients" and then click on Save.
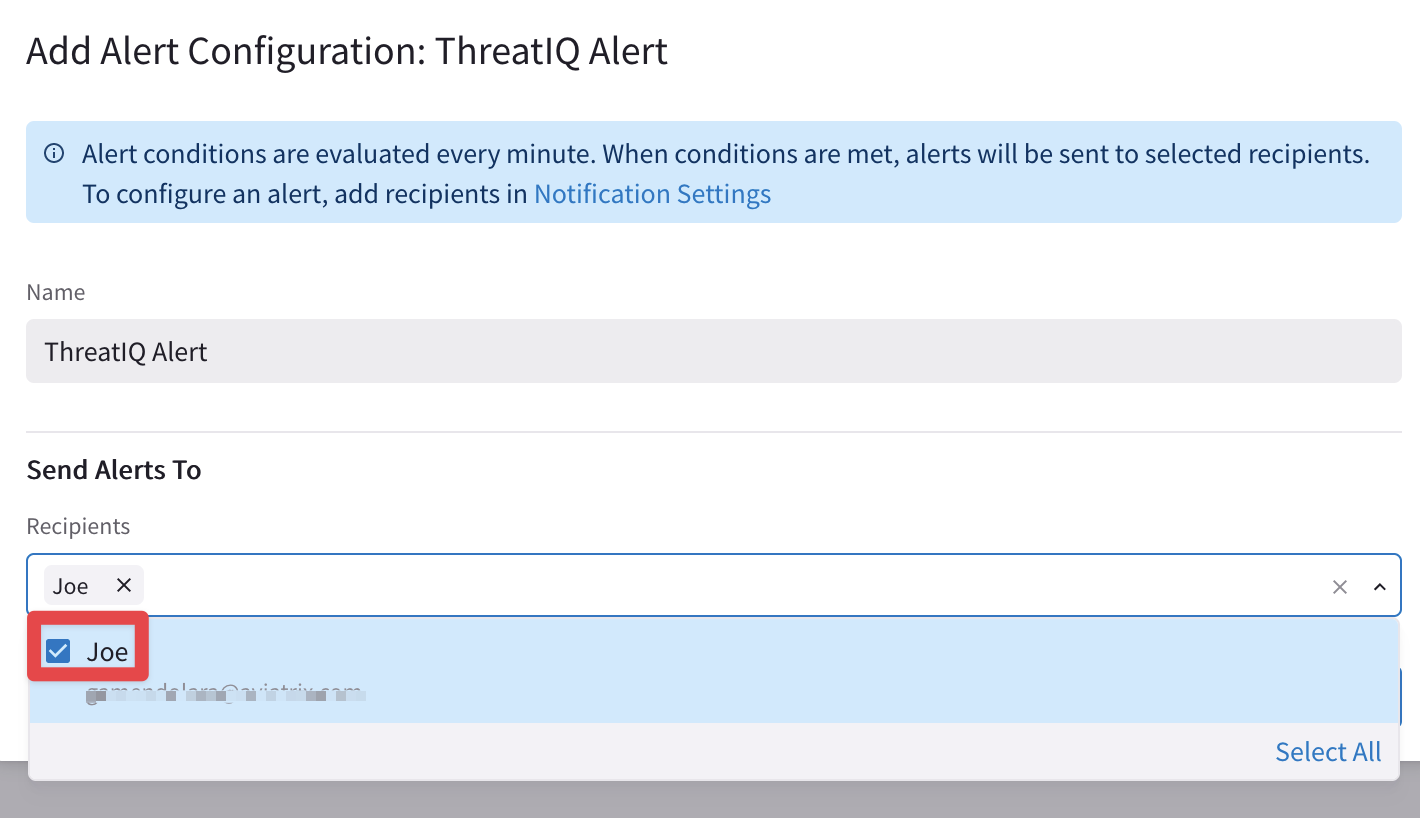
Fig. 318 Add Recipient(s)#
From this point onwards, if you enter a valid email address, you will receive email notifications about ThreatIQ alerts.
Before enabling the blocking, ensure that the ThreatGuard firewall rules order is set to Prepend on the right-hand side.
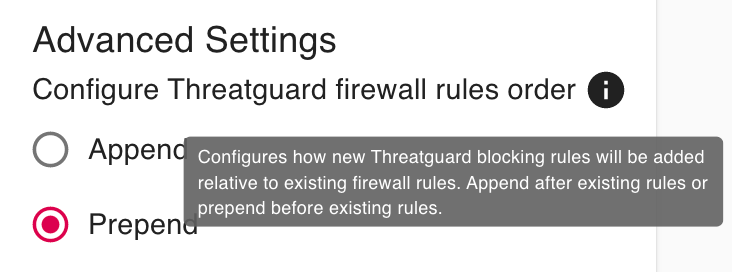
Fig. 319 Prepend#
5.1 Generate traffic towards the “Bad Guy”#
Wait for the instructor to provide a malicious IP. Let’s call it <malicious-IP>.
Important
Note down this IP address!
SSH to the EC2 instance aws-us-east1-spoke1-test1
Now test
ThreatIQby first issuing this command (make sure to enter HTTPS):
curl https://<malicious-IP>

Fig. 320 Curl towards the malicious IP#
Navigate back to CoPilot > Security > ThreatIQ > Overview
Note
Wait for about 4-5 minutes, before proceeding with the next action.
Set the Time Period to "Last 24 Hours" and click on Apply.
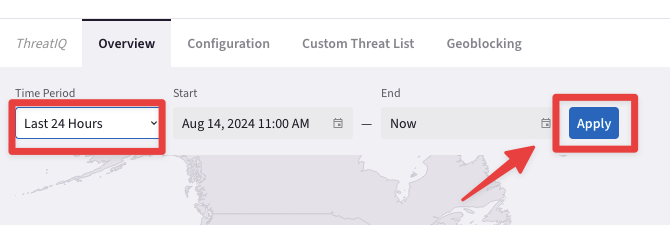
Fig. 321 Overview#
You should see the IP in the table at the bottom. You can filter based on the destination IP address (insert the malicious IP address):
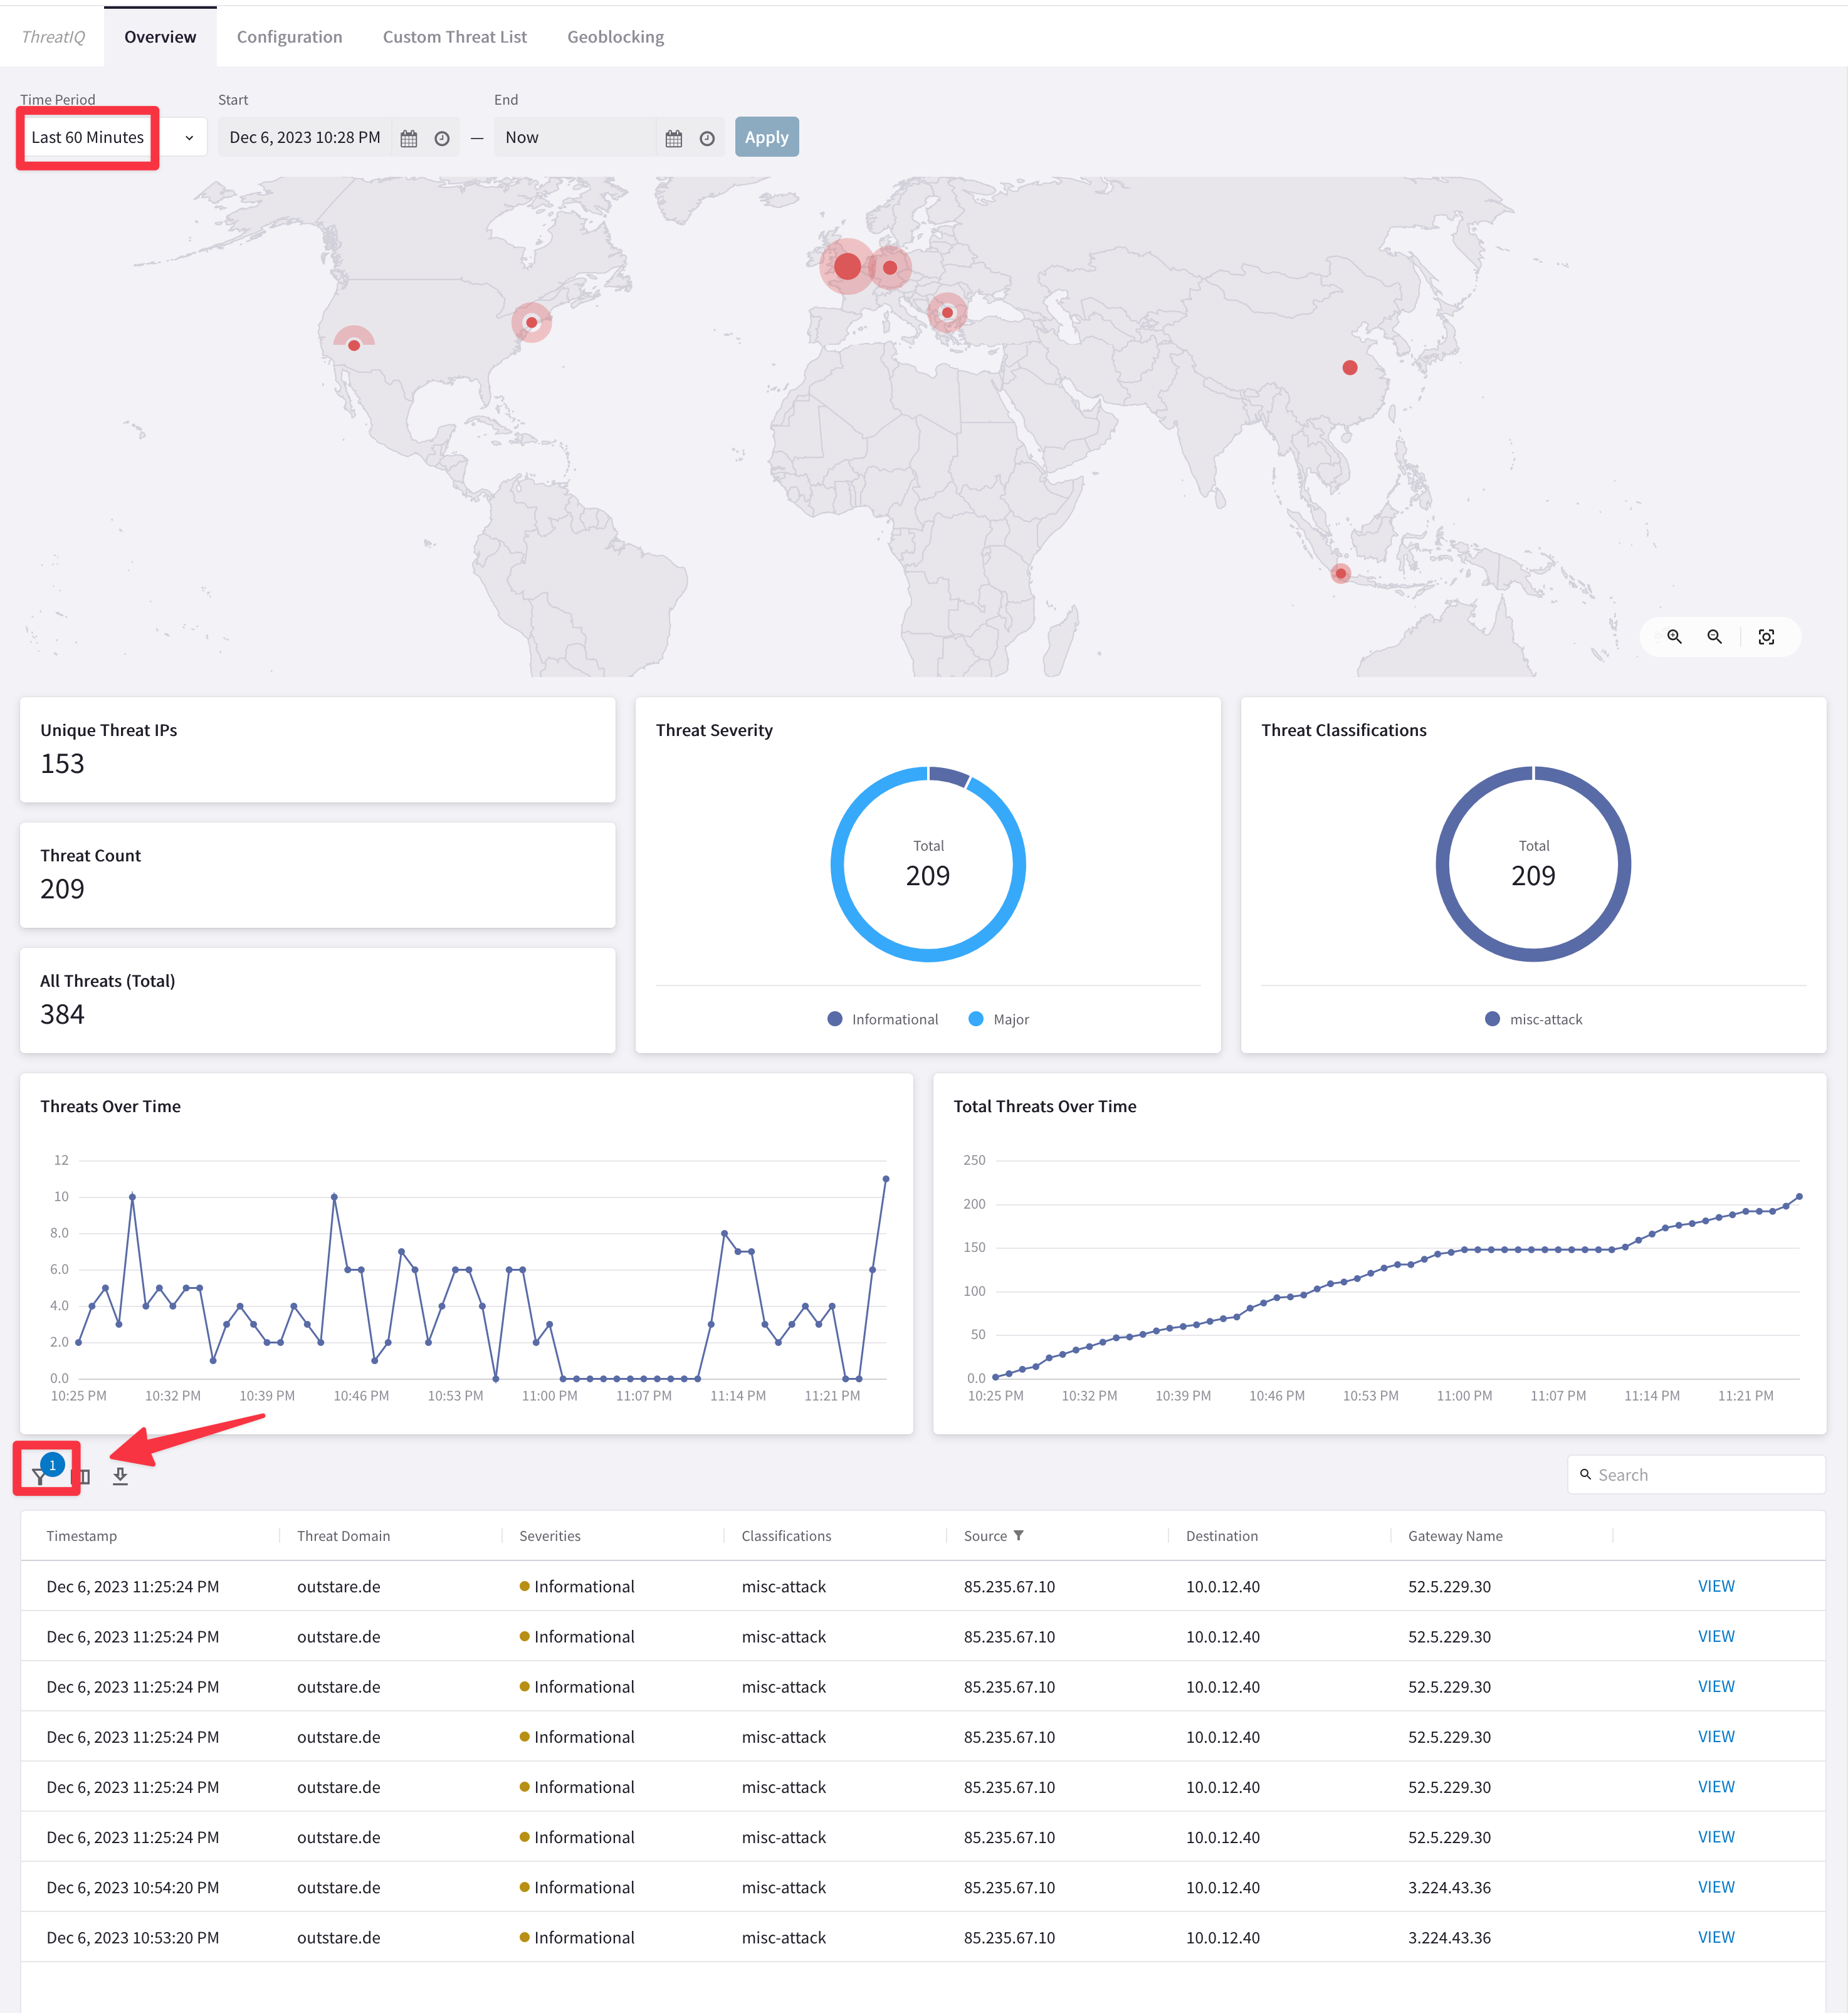
Fig. 322 Threats#
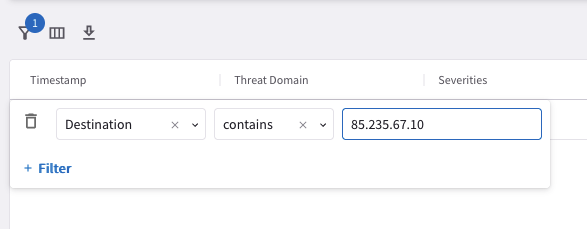
Fig. 323 Filter#
Tip
If you do not get any outcomes, kindly change the Time Period to "Last 60 Minutes".

Fig. 324 Trigger the outcome#
Afterwards, click on VIEW on the right-hand side of the Timestamp.
Note
The IP shown in these screenshots might not be deemed a threat when you read this. Please use the malicious IP provided by the instructor.

Fig. 325 View#
Then select Threat Summary and pinpoint the metadata “tag” to determine how ThreatIQ has classified this IP.
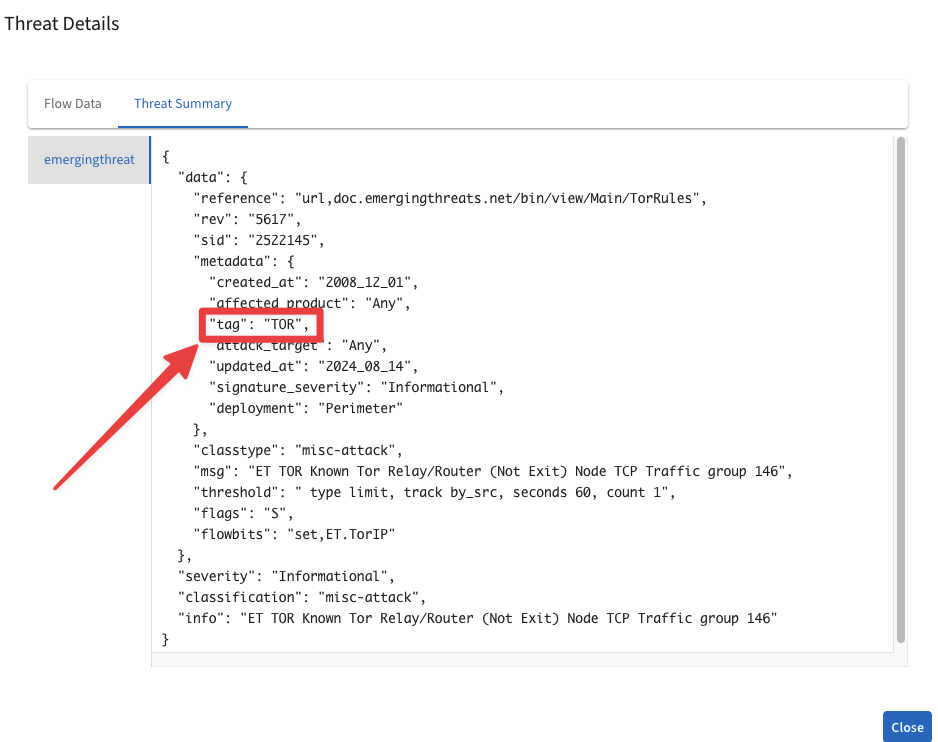
Fig. 326 “tag”#
5. Enforcement#
Enable Block Threats
Tip
Go to CoPilot > Security > ThreatIQ > Configuration, click on the arrow to show the hidden section and then turn on the toggle "Block Threats".

Fig. 327 Click on the arrow!#
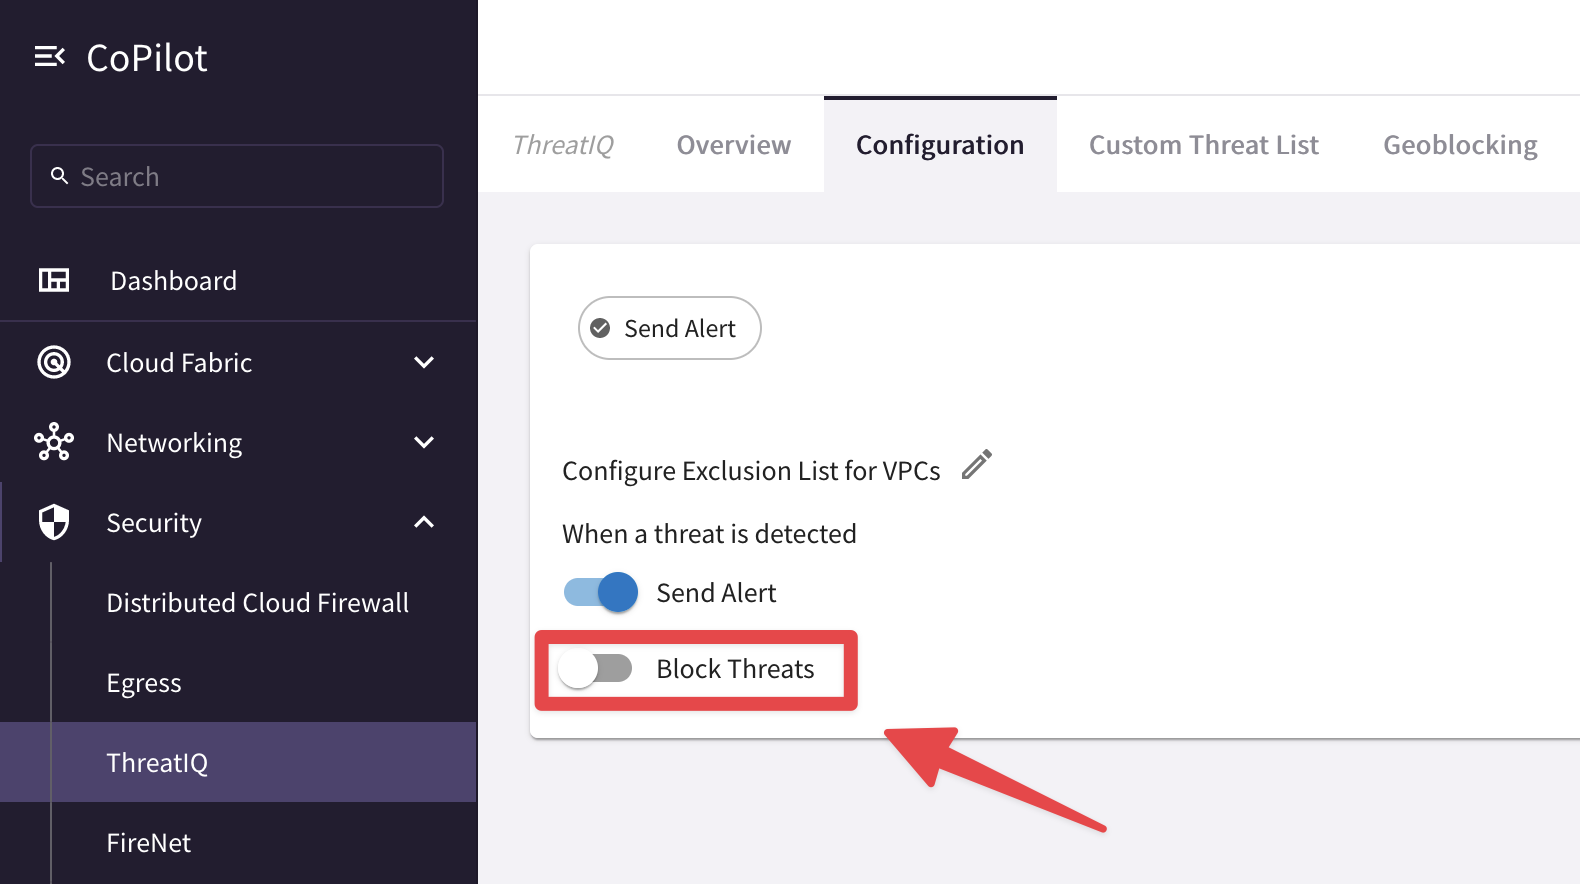
Fig. 328 ThreatIQ - Automatic Enforcement#
By default, all VPCs are enabled for ThreatIQ, therefore click on Save to continue.
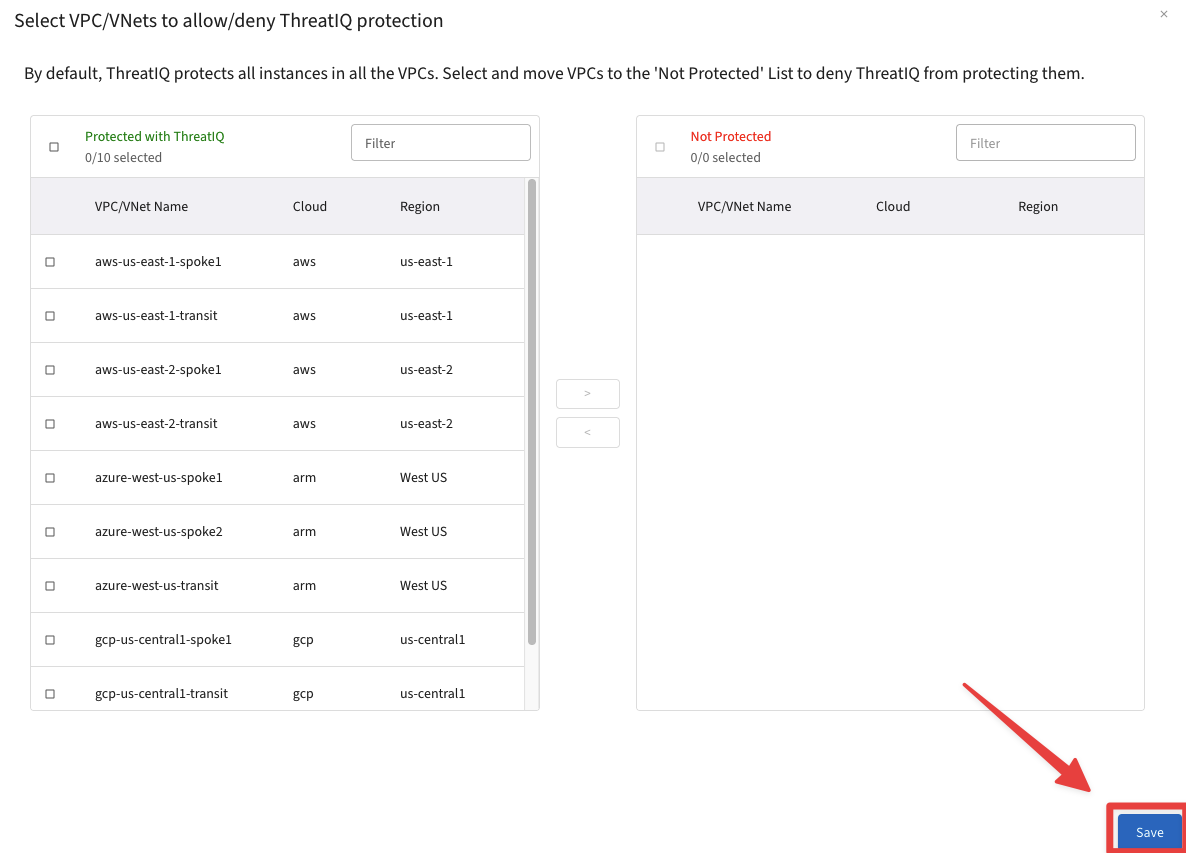
Fig. 329 Select VPC#
Then, click CONFIRM.
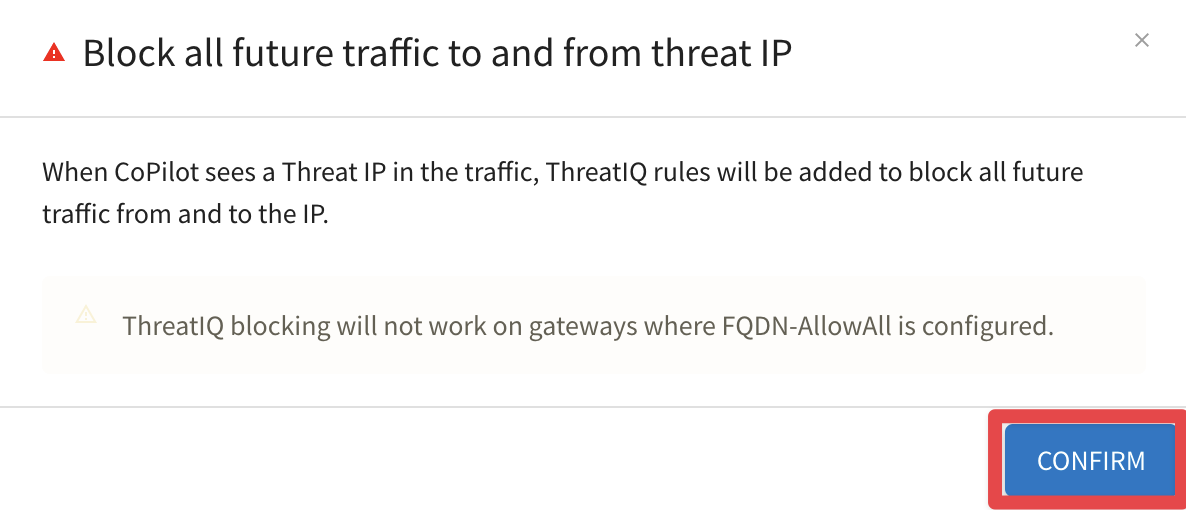
Fig. 330 Confirm#
5.1. Automatic enforcement: “force-drop”#
Now wait for about 8 minutes!
Then issue the same curl command once again, from the test instance aws-us-east-1-spoke1-test1
Caution
Do not issue the curl command immediately! Wait for 8 minutes as suggested above.

Fig. 331 Curl fails#
Navigate to CoPilot > Security > ThreatIQ > Configuration
Note
The CoPilot UI frequently changes, and what you see below may differ from your experience.
Click on the refresh button under.

Fig. 332 Refresh button#
Click on VIEW under the column View Rules, on the aws-us-east-1-psf row:

Fig. 333 View Rules#
Filter based on the malicious IP (choose the Source IP as parameter): you will find out that ThreatIQ applied the enforcement "force-drop".

Fig. 334 Filter on Source IP#
ThreatIQ has successfully blocked the malicious IP!
Warning
Before ending this lab, remove your email from the notification list!
Navigate to CoPilot > Monitor > Notifications > Alerts Configuration
Click on the pencil icon for editing the configured alert named "ThreatIQ Alert":

Fig. 335 Edit ThreatIQ Alert#
Remove the recipient that is identified based on the alias that you chose before, then click on Save.
ThreatIQ will immediately stop sending the alerts to your personal email:
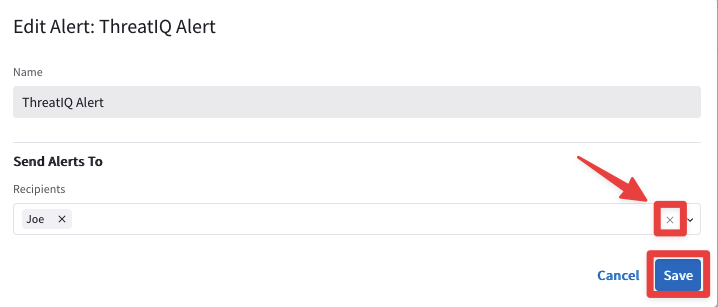
Fig. 336 Stop alerts#
6. CostIQ#
Before completing this lab, let’s enable CostIQ and define the following Cost Centers and Shared Service.
COST CENTERS:
AWS:
aws-us-east-1-spoke1
aws-us-east-1-spoke2
GCP:
gcp-us-central1-spoke1
AZURE:
azure-west-us-spoke1
azure-west-us-spoke2
SHARED SERVICE:
NEW YORK DC:
workstation client “edge”
Go to Copilot > Billing & Cost > CostIQ and click on the "Enable CostIQ" button.

Fig. 337 Enable CostIQ#
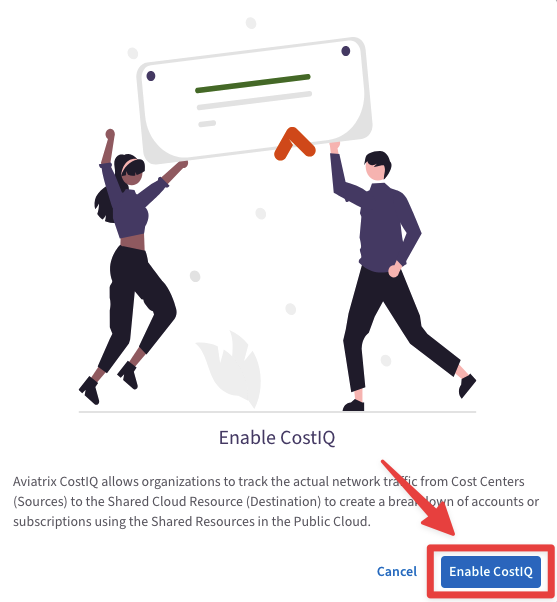
Fig. 338 Enable CostIQ#
Now click on "+ Cost Center" and create the AWS Cost Center aforementioned.
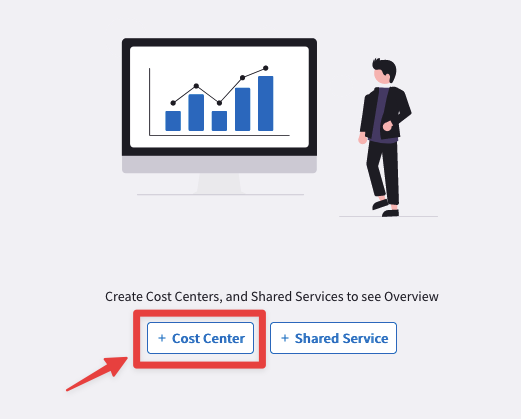
Fig. 339 “+ Cost Center”#
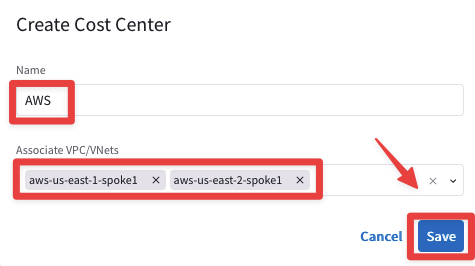
Fig. 340 AWS#
Repeat the action creating the remaining two Cost Centers: GCP and Azure, associating the corresponing Application VPCs/VNets.
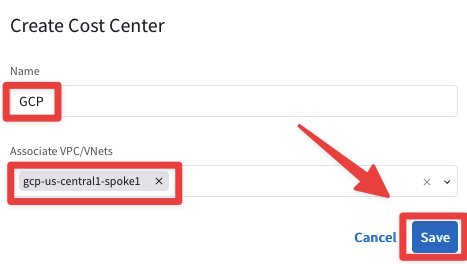
Fig. 341 GCP#
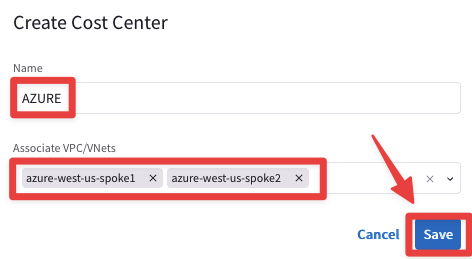
Fig. 342 AZURE#
You should immediately get insights on how they have been utilized.

Fig. 343 Cost Centers Overview#
Now let’s discover the CIDRs of New York DC:
Go to CoPilot > Diagnostics > Cloud Routes > BGP Info, then click on the three dots icon and select the
"Show BGP Learned Routes".
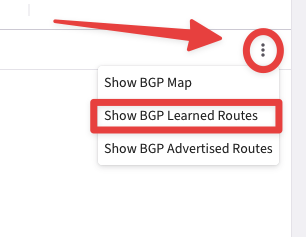
Fig. 344 Show BGP Learned Routes#
You will find out that all the local subnets advertised by the DC belong to the cidr 10.40.0.0/16.
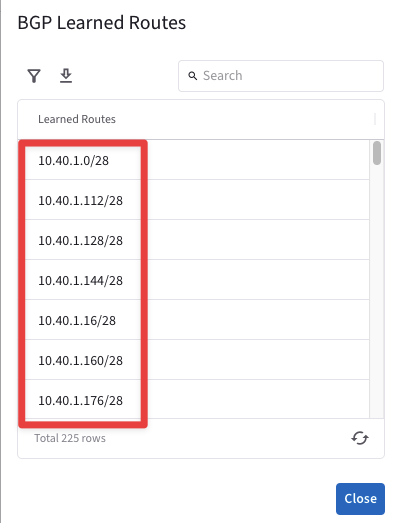
Fig. 345 CIDR#
Let’s move on the Shared Service tab and click on "+ Shared Service".
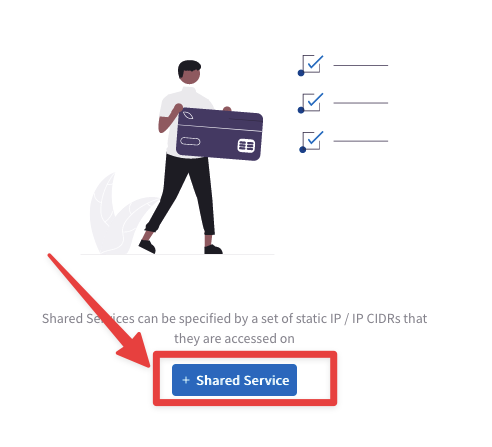
Fig. 346 “+ Shared Service”#
Create the Shared Service based on the aforementioned requirements.
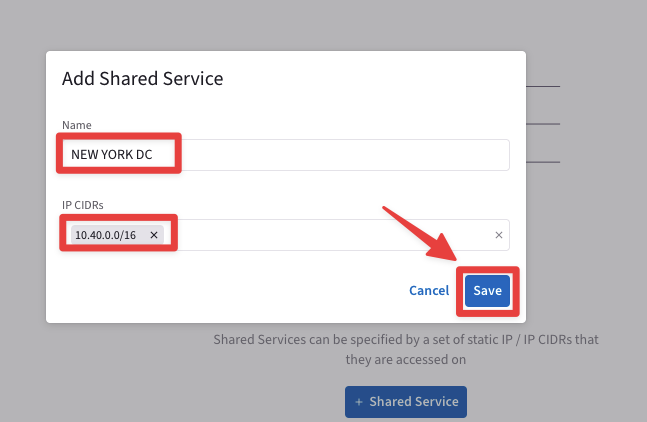
Fig. 347 “+ Shared Service”#
If you kept running the ping on the Workstation Edge’s terminal, then you should see both the relative traffic and the absolute one from any Cost Centers towards the Shared Service.
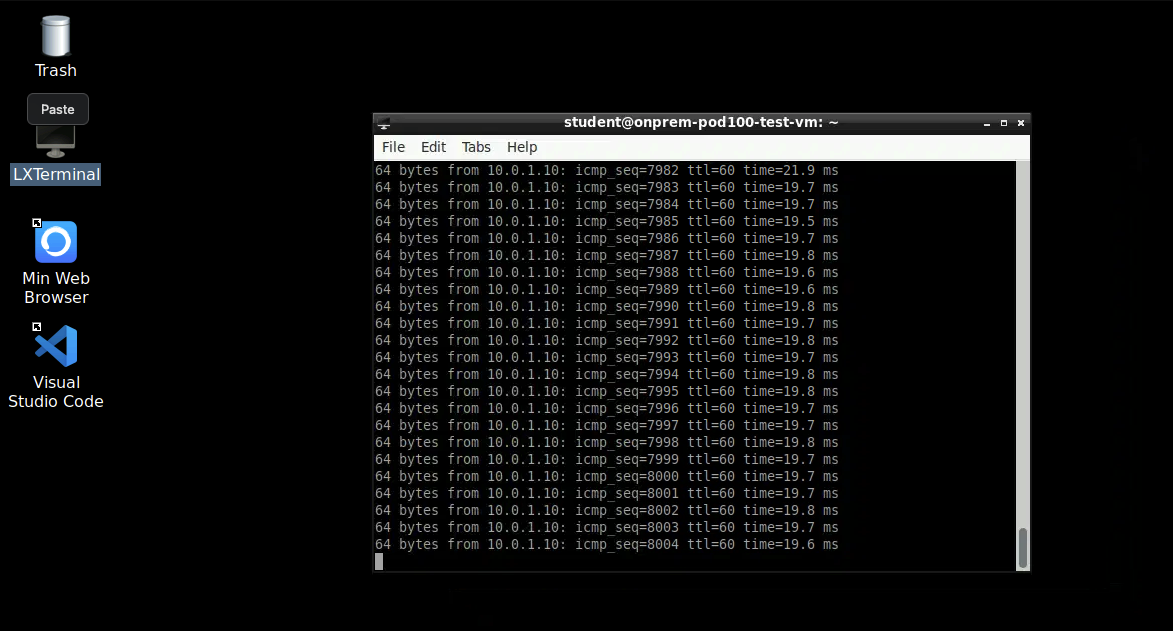
Fig. 348 Ping from the Wortkstation “Edge”#
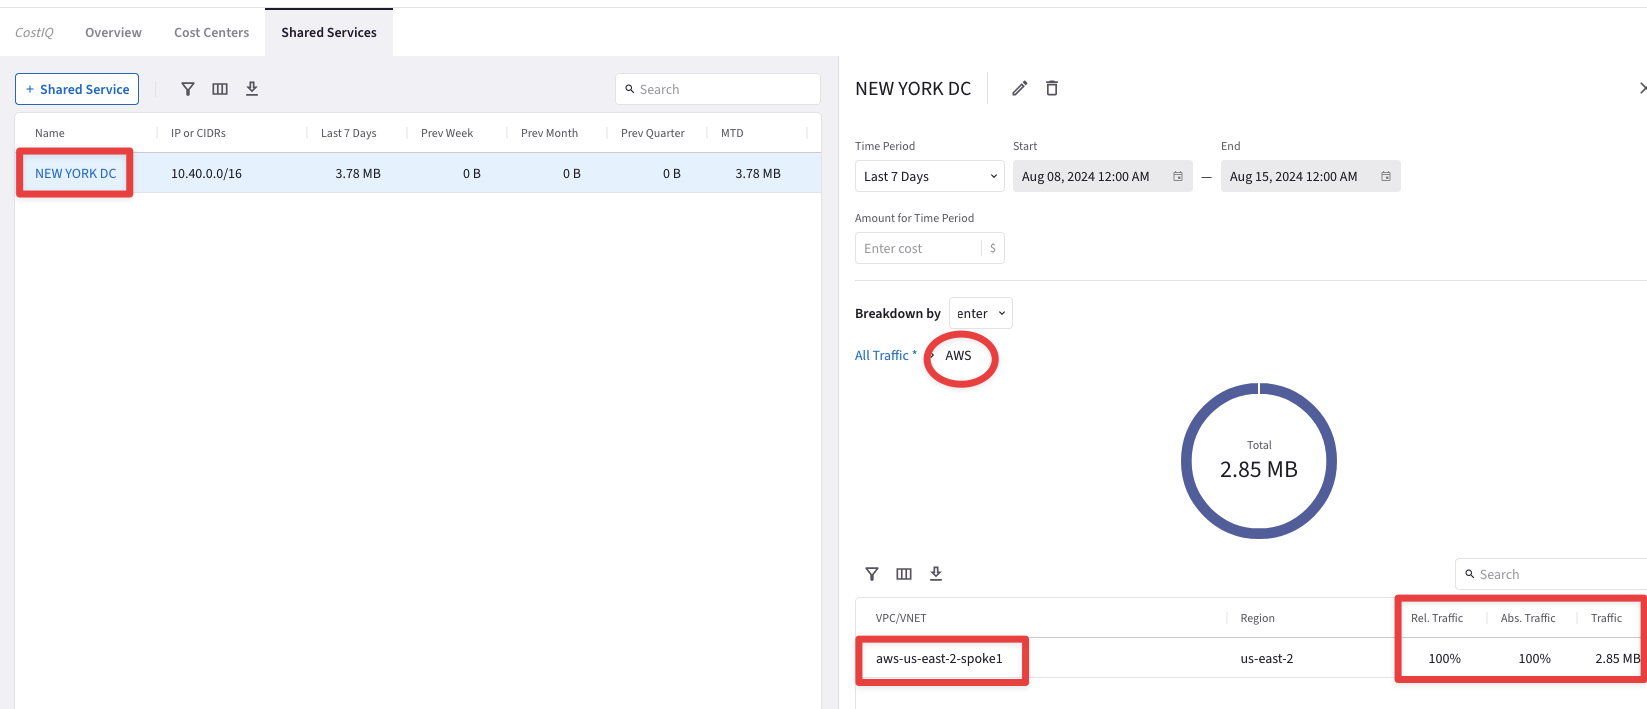
Fig. 349 From the Cost Center towards the Shared Service#
After this lab, this is how the overall topology would look like:
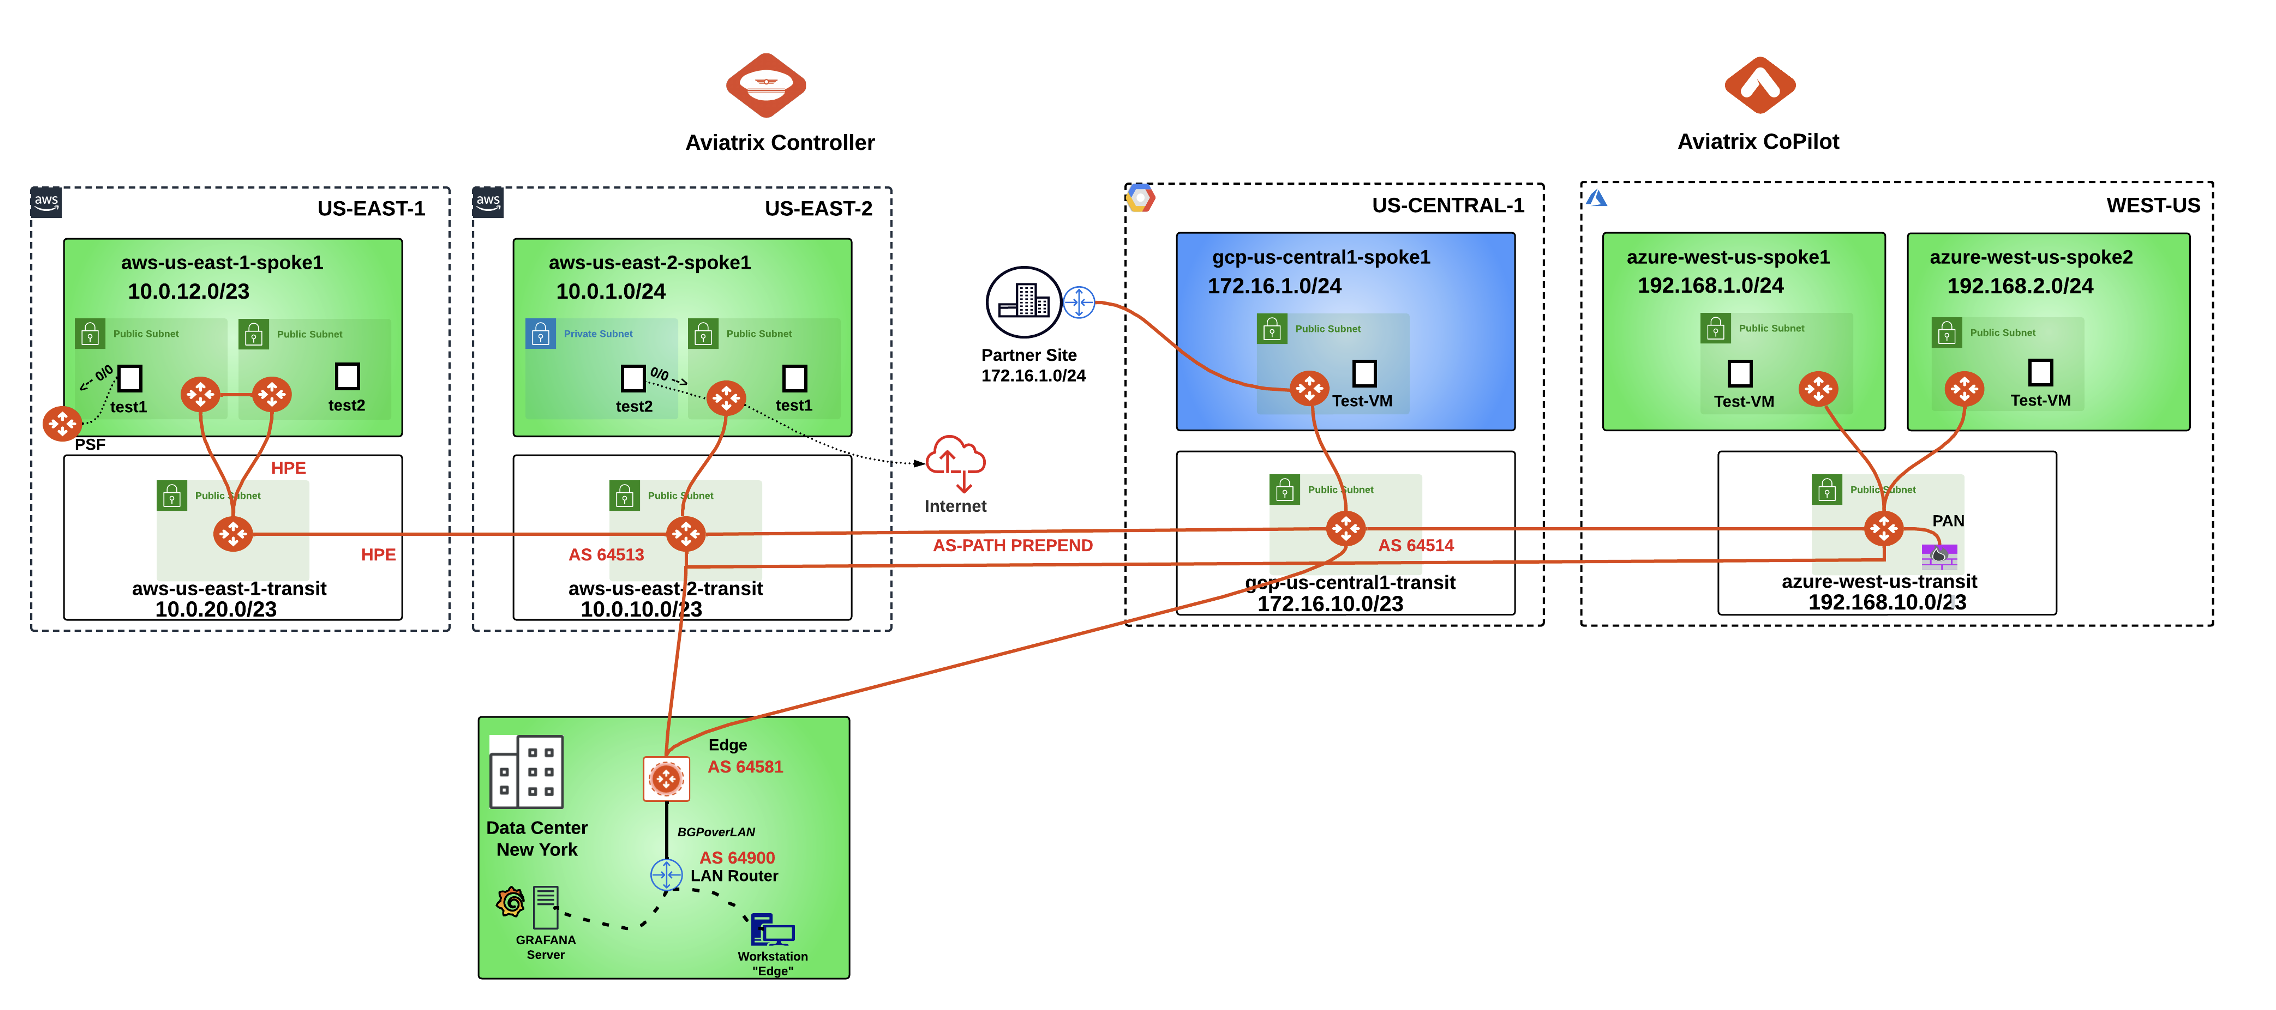
Fig. 350 Final topology for Lab 9#
